Explore
Need help with your project?
This field is required
Incorrect phone number
Incorrect Email
This field is required
Please fill in all fields
Next
Далее
Your role in the project
Services
Budget
Please select one option in each category
Submit
Submit
several colorful figures
Request sent
Our manager will contact you shortly.
Oops! Something went wrong while submitting the form.
Think your design is good? Grab your free interface checklist to be sure
Quickly assess how effective your design is and see if there’s anything worth improving.
This field is required
Incorrect Email
Please fill in all fields
Done! Check your email to view the checklist
Oops! Something went wrong while submitting the form.
Reading time:
10
mins

How We Created Freelife — a MedTech App for Blood Glucose Monitoring. Case Study

Sergey Nikonenko
COO at Purrweb
Published
March 17, 2026
Updated
March 18, 2026
Freelife case study facts and fugures
Freelife tags

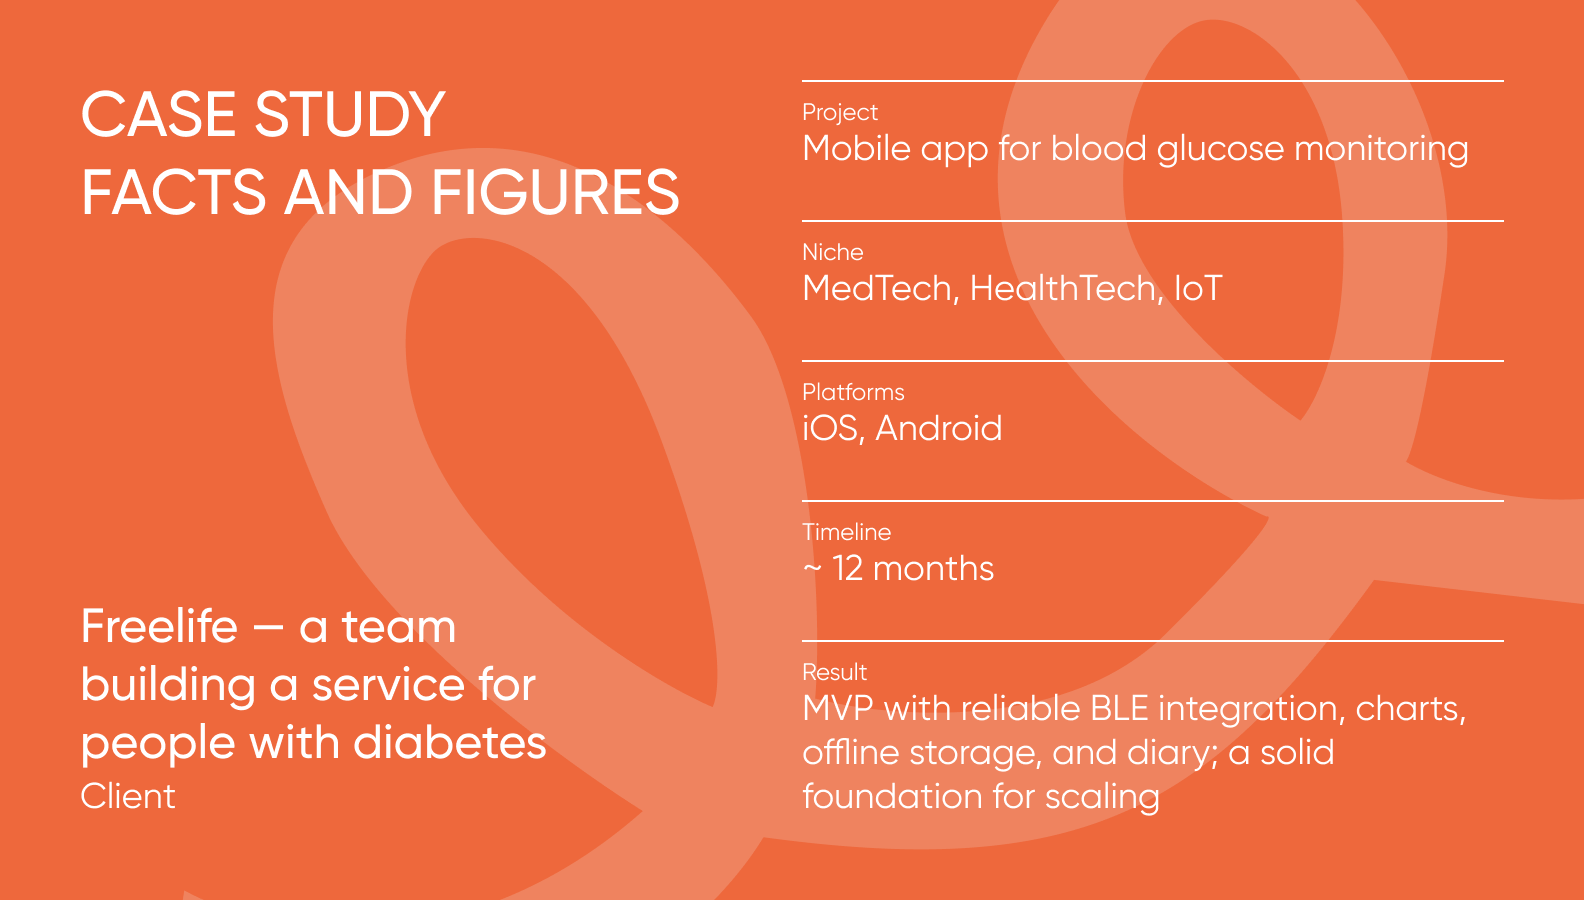
For people with diabetes, monitoring blood glucose levels and noticing changes in time is critically important. The Freelife team approached us with a request: to build a user-friendly mobile app that receives data from a Libre sensor, allows users to store and track dynamics, and maintain a well-being diary.

This is the story of a digital product that provides real value to people. For this project, we improved the UX, adapted the design, built the frontend, integrated the sensor, and tested the app in real-world conditions. Ultimately, we delivered a stable MVP that helped the client to move forward.

What the product is and why it’s needed

Glucose monitoring is part of daily life for people with diabetes. Many factors influence blood sugar fluctuations. In order to react in time, a person needs a clear understanding of their condition. This is where MedTech comes in, automating routine tasks.

The Freelife app:

  • receives real-time data from the Libre sensor,
  • displays it on a chart,
  • allows logging meals, medications, measurements, and other daily events,
  • helps identify correlations.

Rather than keeping everything in memory or recording it on paper, users have a convenient tool that supports them every day.

Mobile app screen of Freelife with glucose monitoring: current glucose level displayed at the top, along with active insulin and bolus calculation. The bottom part of the screen shows a 2-hour glucose change chart and a button to add an entry.
Freelife main screen: current glucose level, graph, and quick access to diary, statistics, and settings

What’s important — the app must remain simple, so it’s easy to use from the very first launch. Therefore, our focus was not only on device integration but also on making the product intuitively clear in every detail.

The client came with an understanding of medical specifics, UX groundwork, and user feedback from their previous web service. However, there was no mobile app. Our team had to unify the flows into coherent logic, adapt the design, ensure stable sensor connection, and deliver an MVP that could be shown to investors and launched for testing.

Want your product to help people in real life too?
At Purrweb, we create interfaces and architecture that work in real-world scenarios.
Contact us — let’s discuss your project

The tasks we faced

To make the app work as intended, we needed to focus on three key areas:

1. Ensure stable sensor connection. Freelife is built around data flow from the Libre sensor, which updates every 5 minutes. It's crucial that data arrives seamlessly.

For us, this meant:

  • connecting the sensor via Bluetooth,
  • building a predictable connection process,
  • making the app resilient to connection loss,
  • ensuring proper functionality even without the internet connection.

This was the main technical focus of the entire MVP.

A window in the Freelife app asking the user to turn on Bluetooth to connect the device. In the center — a Bluetooth icon, below the text “Turn on Bluetooth to connect the device” and a warning “Activate CGM sensor” with explanation. At the bottom — a “Go to Settings” button.
The system tells the user to turn on Bluetooth to connect the sensor

2. Create though-outl UX. Freelife users are very diverse: teenagers, adults, and elderly people. They have different levels of digital literacy. Therefore, the interface must be as clear as possible with no lengthy learning curve. The app design is uncluttered and helps users log important information without extra steps.

Three screens of the Freelife app with forms for entering data into the diary: therapy, meals, and glucose measurement.
Diary forms: therapy, meals, and glucose measurement

3. Prepare a working MVP within tight deadlines. The client needed to show investors a functioning product by a specific date, so we helped focus on the most essential features. These were:

  • authentication,
  • sensor connection,
  • main screen with chart,
  • diary,
  • profile.

Everything a user needs to start using the app right away.

Thanks to clear focus and teamwork, we delivered the result on time — and the client was able to present a product, not just a mockup.

Diabetes diary interface. It displays a calendar spanning several days and has sections for entering data about breakfast, lunch, and dinner, as well as physiological indicators.
Diary screen with calendar and sections for logging meals and measurements

App flow

In order for a person with diabetes to manage their condition without unnecessary stress, the app must guide them along a simple path. We designed the flow so that users can navigate it intuitively and without error.

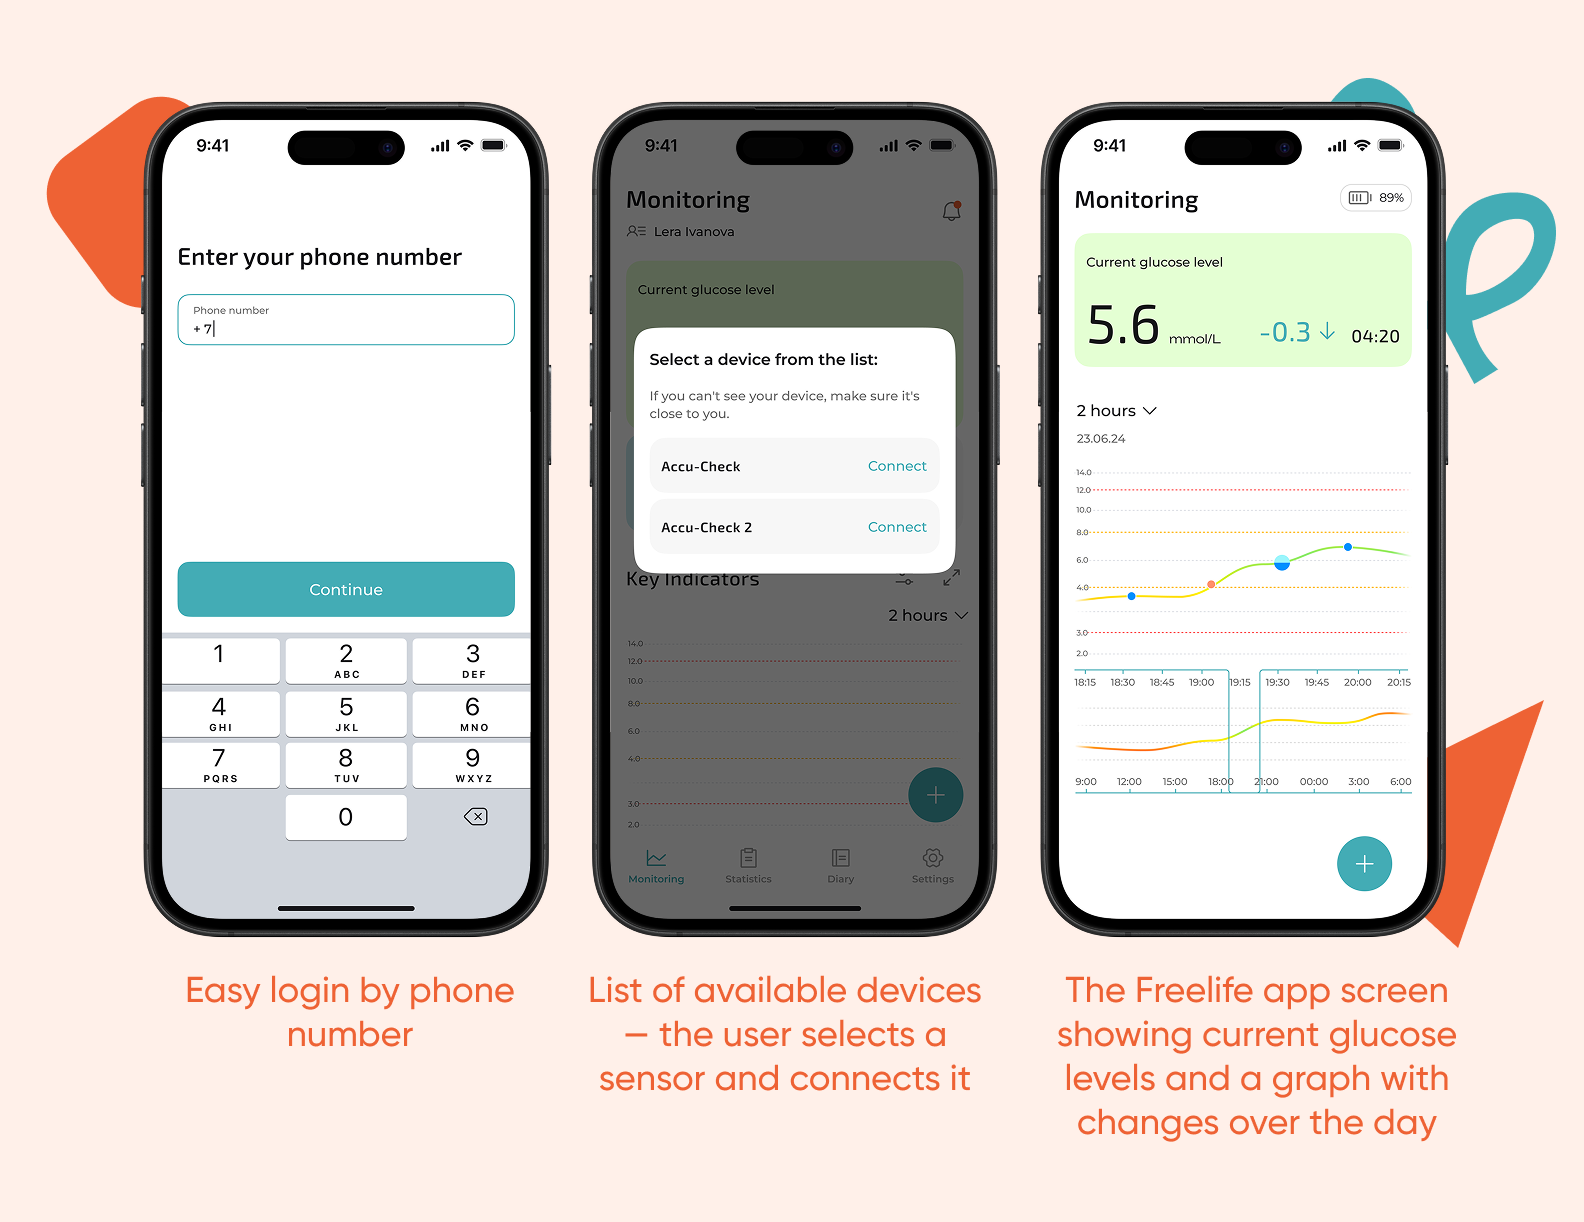
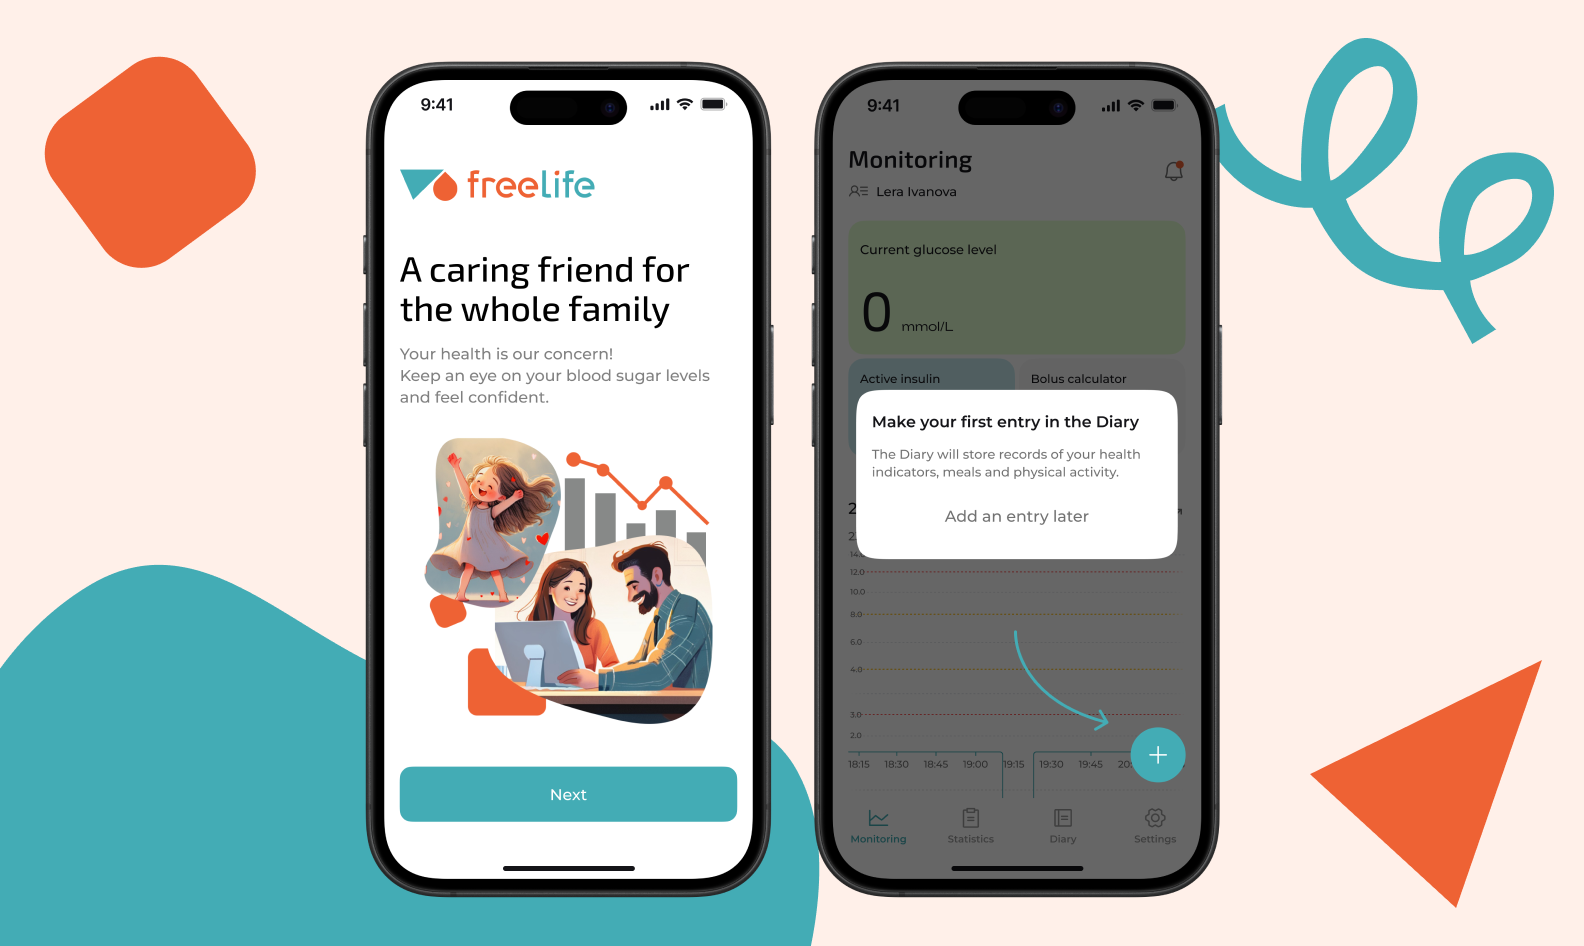
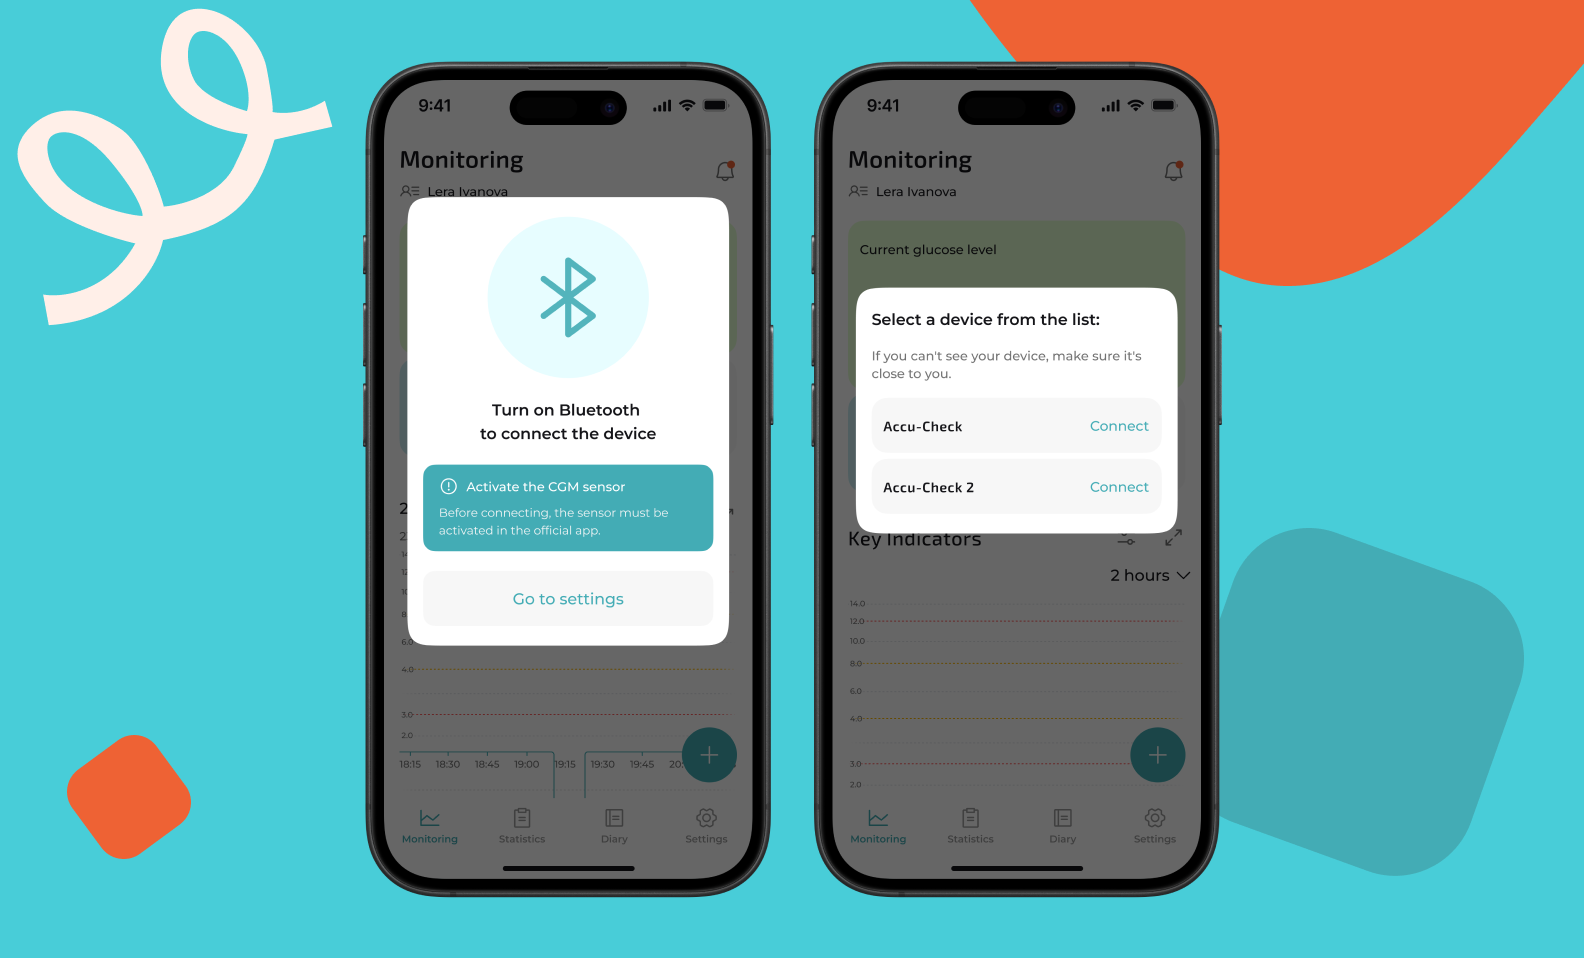
Onboarding and login. When the user opens the app, they immediately understand what to do: log in with their phone number, receive a code, and view brief tips on how the sensor works.

Two app screens. The left screen is the welcome monitoring interface with a suggestion to make the first diary entry. The right screen is the start screen, which has the tagline “A caring friend for the whole family” and a “Next” button.
Freelife app screens during onboarding: welcome and start screens

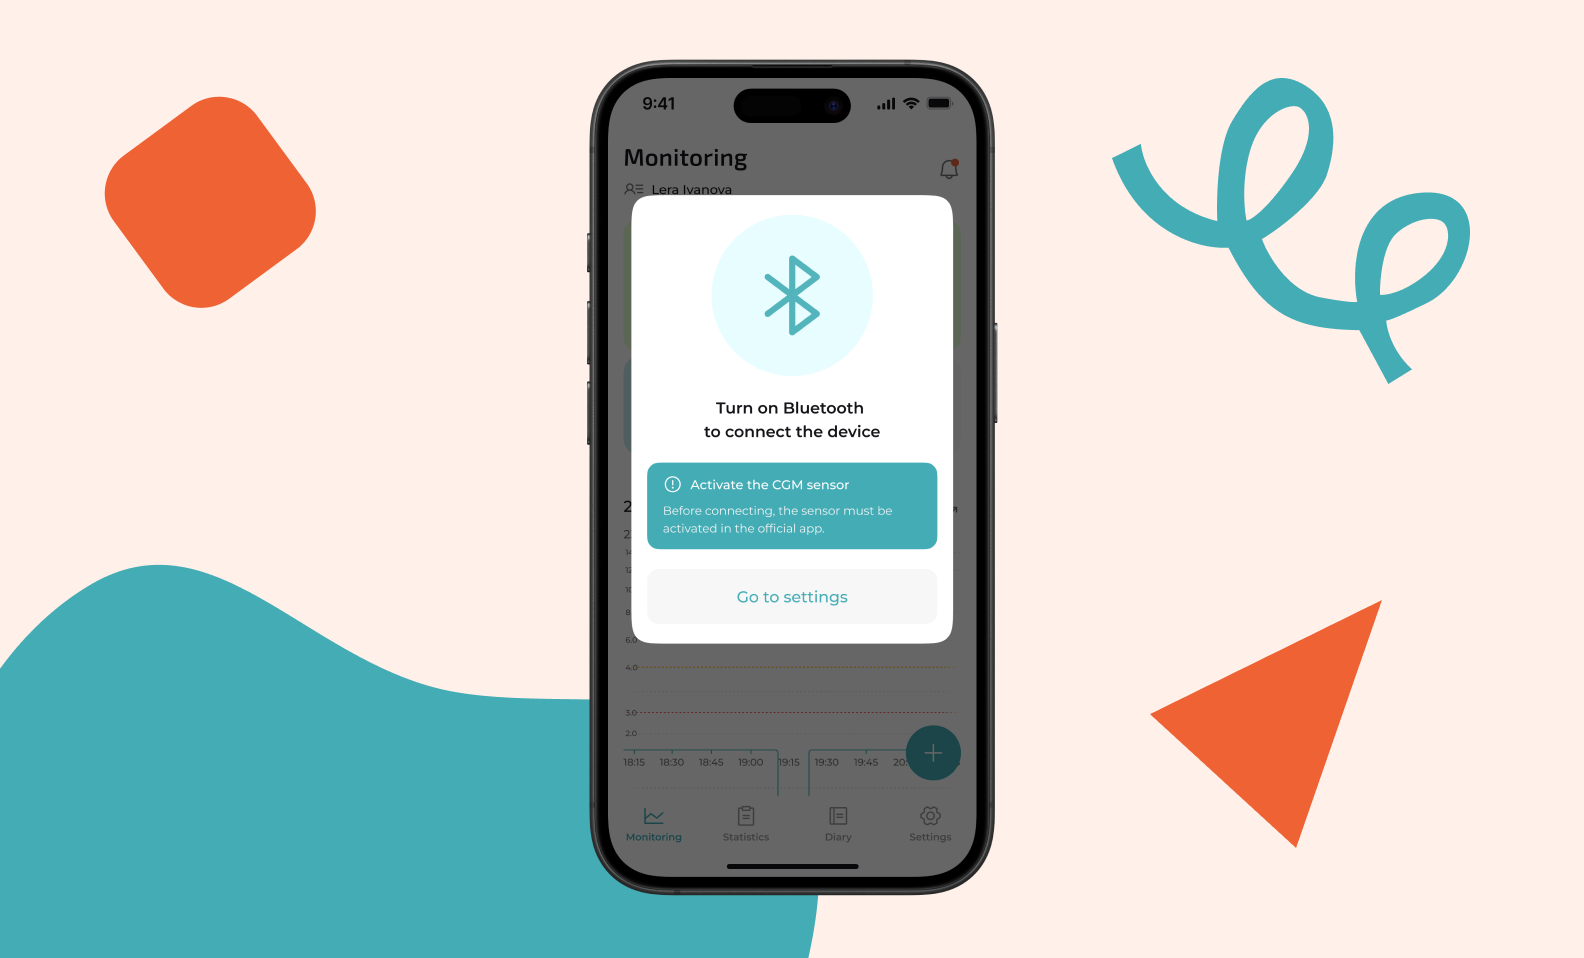
Sensor connection. This is the key step. We made it as smooth as possible:

  • the app checks if Bluetooth is enabled,
  • prompts the user to bring the transmitter close to the sensor,
  • shows the connection status in an easy-to-understand format.

The user doesn't need to understand the technology — just follow simple on-screen steps.

Two screens of the application. The left screen shows a list of devices available for connection (Accu-Check). The right screen shows instructions for turning on Bluetooth and activating the CGM sensor before connecting.
Connecting to Bluetooth and list of available devices

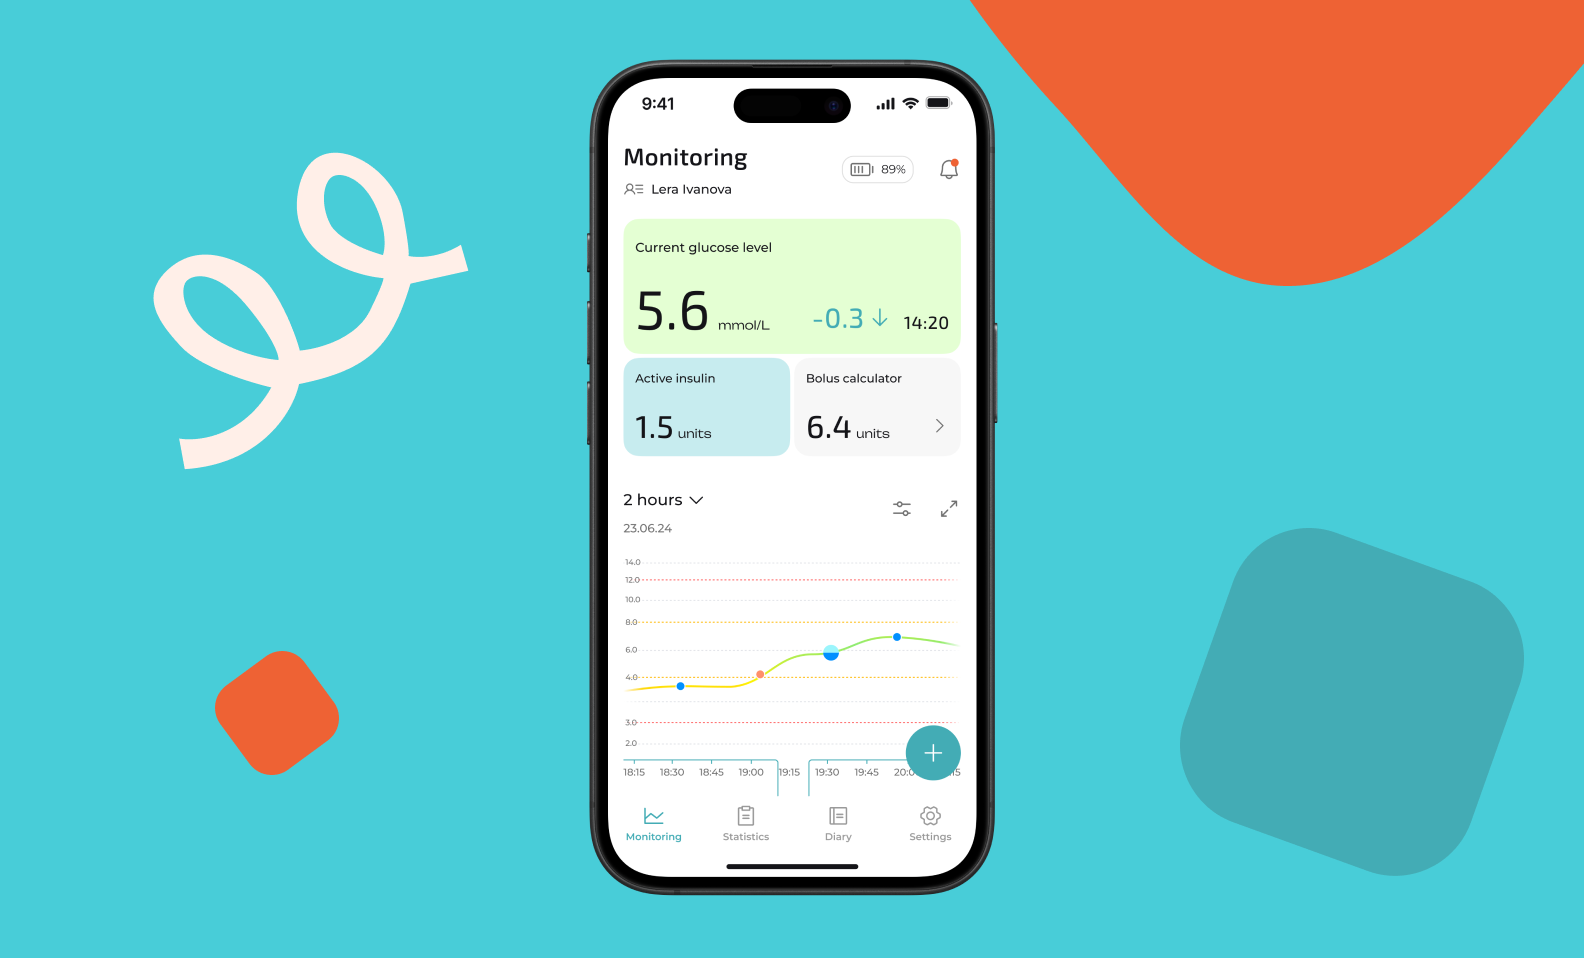
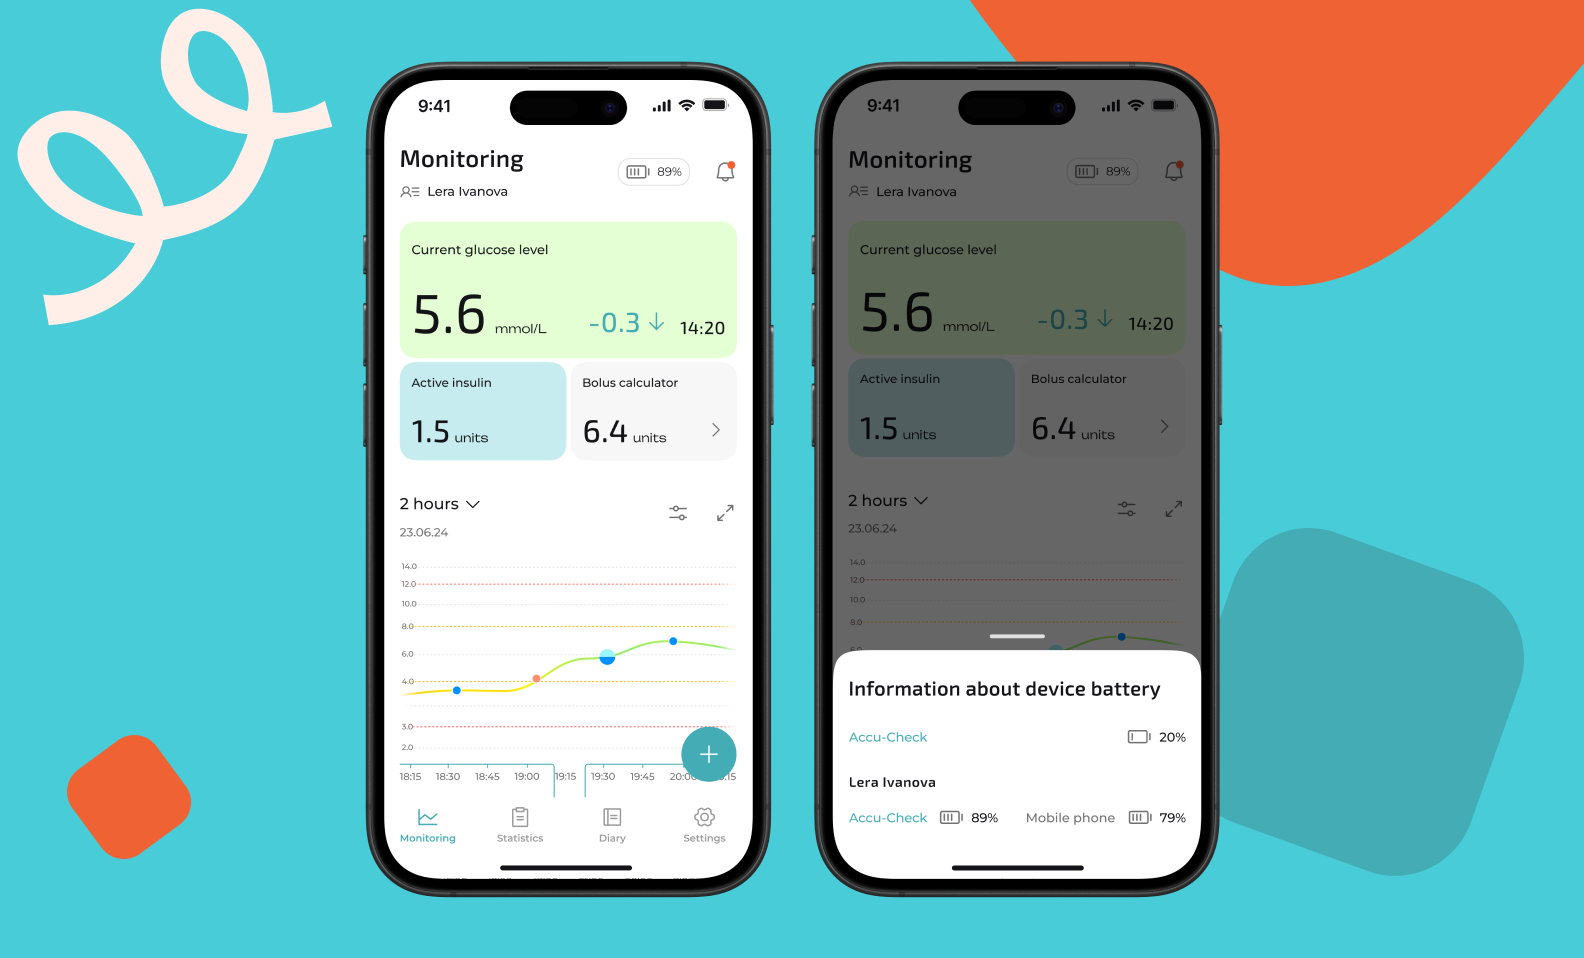
Main screen. Once connected, focus on the status dynamics. The main screen shows:

  • current glucose level,
  • graph for the selected period,
  • noticeable fluctuations,
  • recent changes.

The graph updates automatically and provides a neat overview to help people quickly understand how their day is going.

Two screens of the diabetes monitoring app. Left screen: shows current glucose level, active insulin, calculated bolus, and battery level of connected devices (glucometer and phone). Right screen: more detailed view with same glucose level, insulin data, and historical glucose chart.
Detailed monitoring statistics

Diary

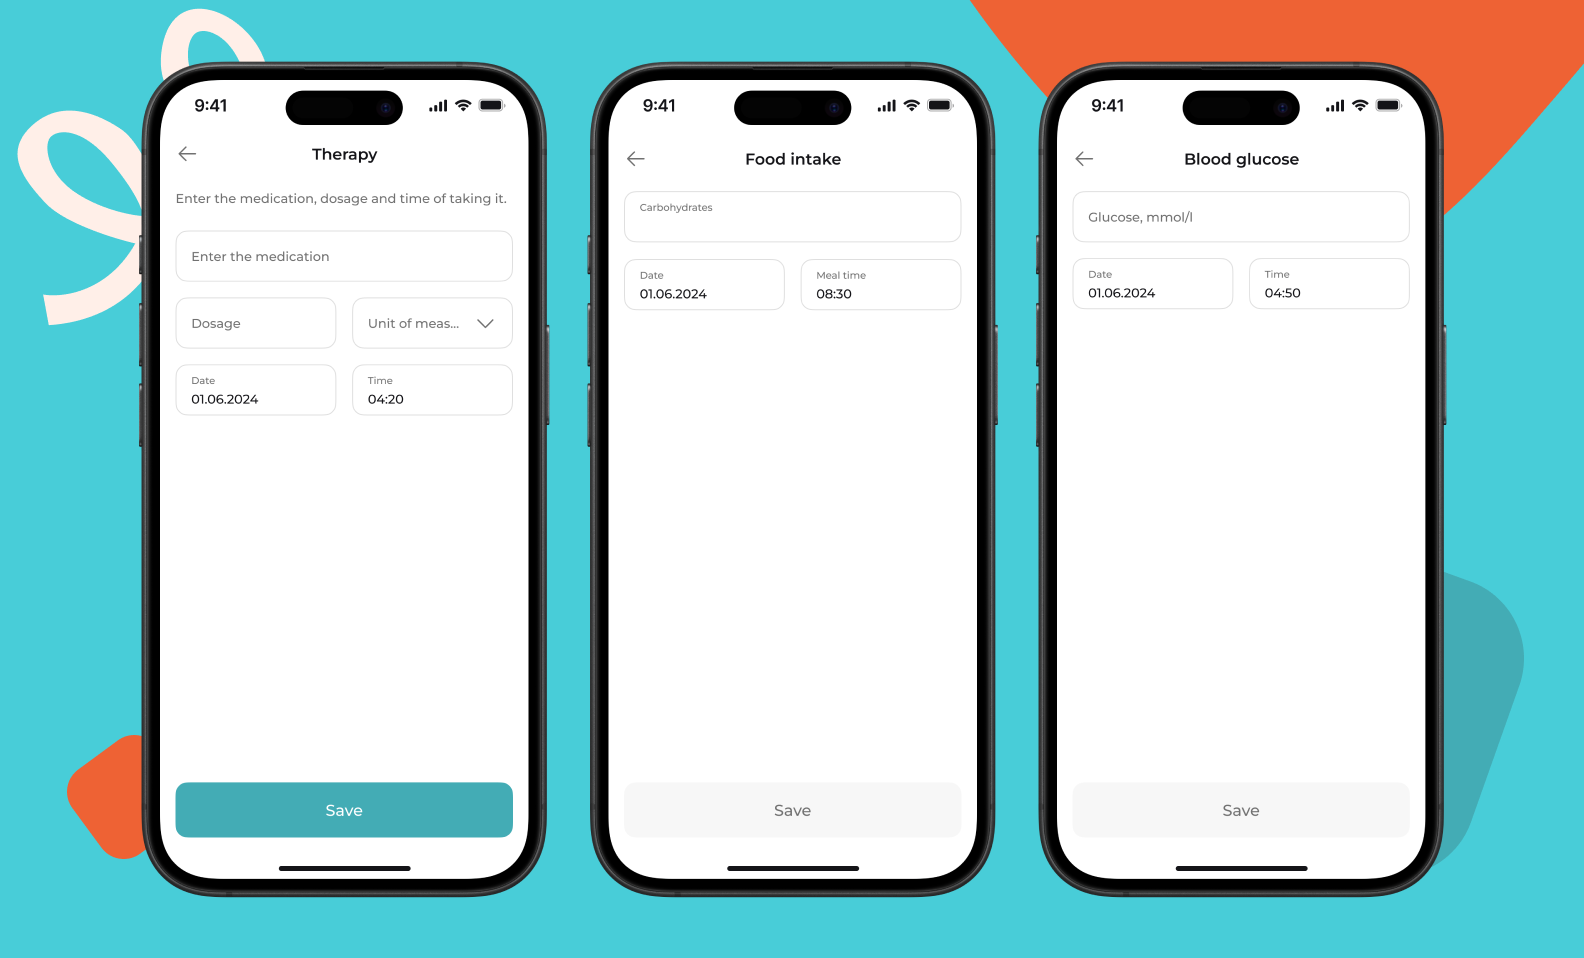
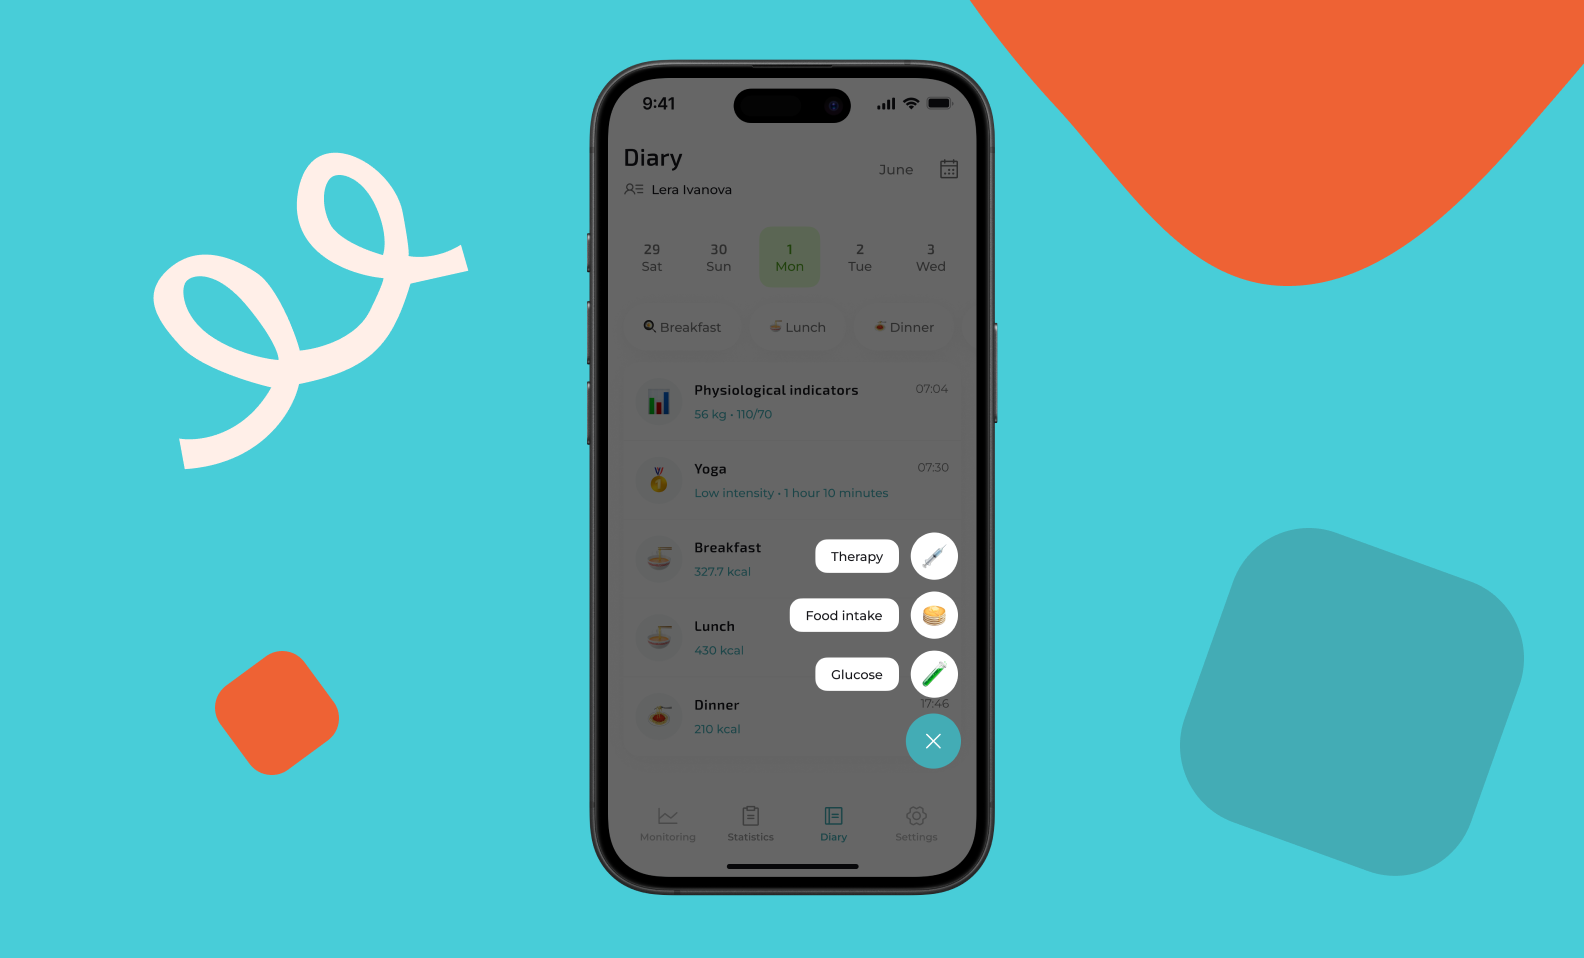
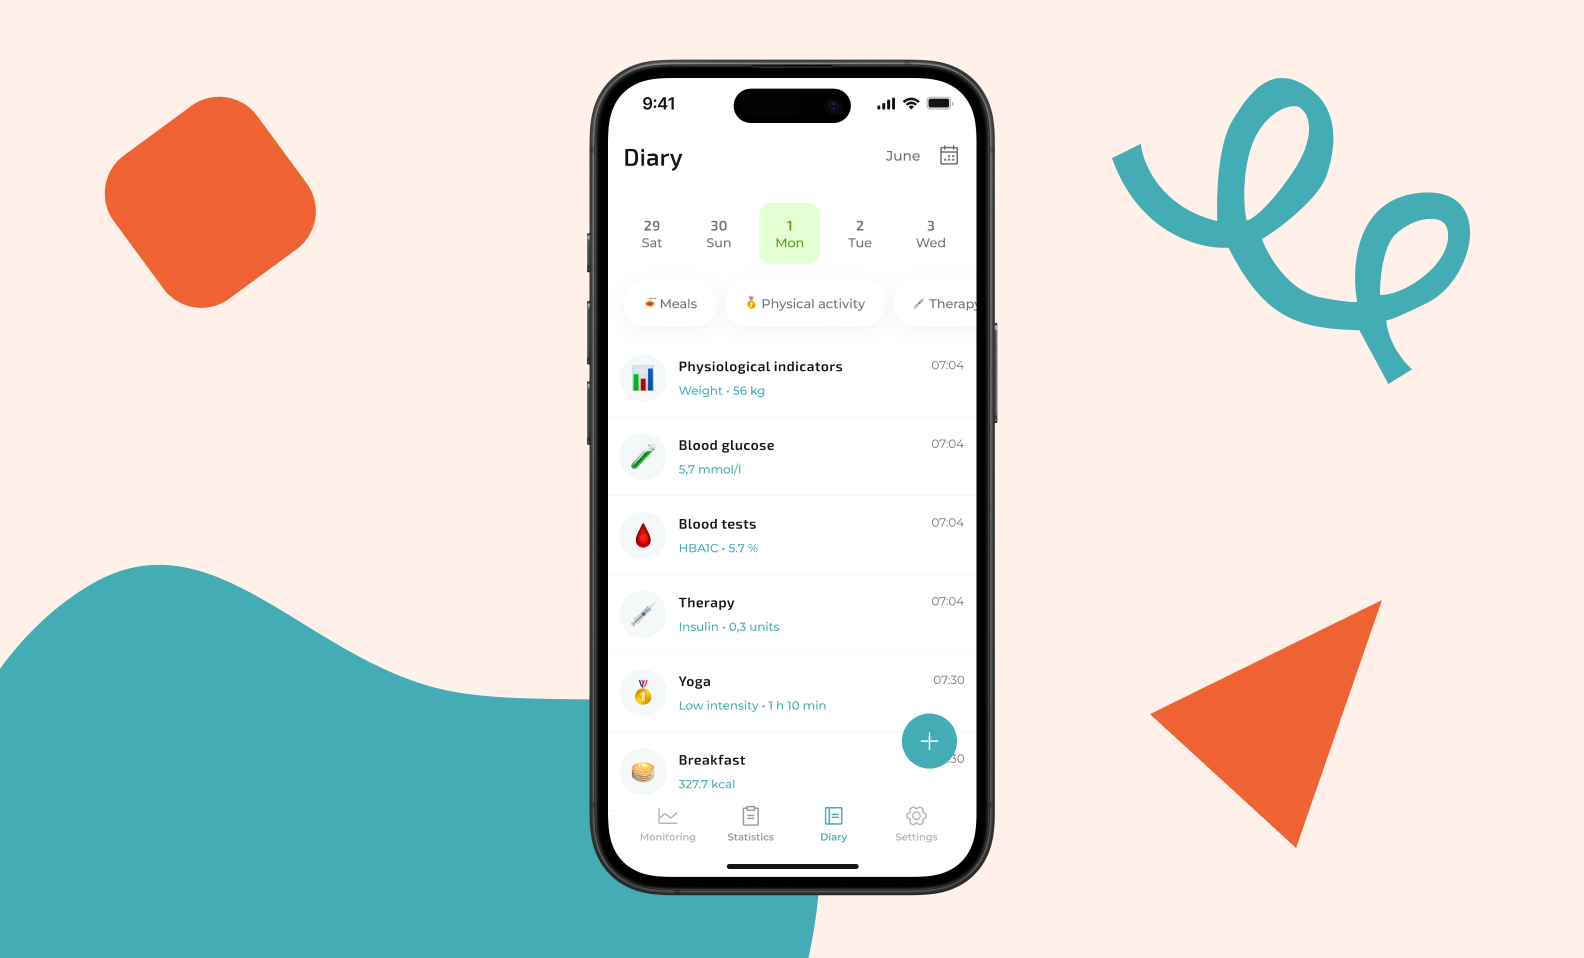
We created a convenient diary where users can quickly add:

  • glucometer readings,
  • carbohydrates,
  • dosage,
  • meals,
  • other indicators.

The forms are compact, clear, and don't require any extra actions. Users can log entries throughout the day.

The diary screen has a calendar at the top and a list of entries for the day below. These entries include physiological indicators (weight), glucose level, insulin dose, yoga session entry, as well as breakfast and lunch calories.
Diary screen in Freelife: calendar and list of entries for the day
Need clear and thought-out UX even for complex processes?
We’ll organize the logic, flow, and visuals to make it easy for users of all ages and experience levels to understand.
Get a free project estimate

Interesting technical solutions

The Freelife interface looks simple, but it has a complex technical architecture behind it. We made it invisible to the user while ensuring the app remains stable. The following are the key technical solutions that made this possible.

Hybrid architecture: React Native + Native modules. The app is built on React Native, but about 70–80% of the core logic is written in Native code (Swift for iOS and Kotlin for Android). We deliberately chose this hybrid architecture.

React Native handles the UI — authentication, diary forms, and navigation. Meanwhile, all device, network, and data operations use Native modules:

  • Bluetooth connection to the Libre sensor
  • HTTP client for backend synchronization
  • Local database for offline mode
  • Glucose chart visualization

Why did we choose this approach? React Native is a wrapper for native platforms. Tight hardware integration and background processes require writing native code directly. Additionally, modules work independently. For example, if a sensor module is written in Swift, it cannot call a database module written in React Native. Therefore, we moved all critical infrastructure to the Native level.

Stable Bluetooth connection and background operation. The Bluetooth connection can be interrupted due to distance (the sensor disconnects at approximately 10 meters), interference, or device restarts. We built a system that:

  • Automatically reconnects when the signal is lost
  • Receives data every 5 minutes, even when the app is in the background
  • Stores data locally when there's no internet and sends it to the backend when connectivity is restored

Background mode works differently across platforms:

  • On iOS, background operation is only possible if the app is in the task manager (minimized but not terminated). Apple's stance: if a user terminates an app, they don't want it to run in the background. We didn't use workarounds and left this limitation as is.
  • On Android, it's simpler: you can launch a background process that continues working even after phone restart or app termination.

All background logic is written in Native services, without third-party libraries.

A chart that accurately reflects dynamics. Initially, we wanted to use React Native libraries, but none of them met our customization requirements.

The chart needed to:

  • Display values at varying frequencies (sometimes data arrives less frequently)
  • Correctly handle empty gaps (e.g., during the night)
  • Scale smoothly when swiped
  • Visually highlight peaks and drops

Ultimately, we wrote native charts for iOS and Android separately. Now, the chart renders instantly and works smoothly, accurately reflecting the user’s condition.

Real-world testing: 10–14 days with a sensor under the skin. Testing couldn't be done on emulators. The sensor is inserted under the skin, and only real-world experience reveals how it works.

Our developer and tester voluntarily wore sensors for the full 10–14 day cycle. Throughout the project, from prototype to release, a total of 4–5 sensors were tested.

We tested:

  • Bluetooth connection stability while moving, at home, outdoors
  • Behavior during connection loss and reconnection
  • Chart performance in real conditions (with data gaps, fluctuations, restarts)
  • Data parsing accuracy (occasionally negative values appeared — 1–2 per day, likely due to sensor glitches or parser issues)

The sensor is waterproof, so users can shower, swim, and exercise with it. We asked our team how wearing the sensors felt. They said they experienced no discomfort 😊 Only curiosity about observing their body's reactions to food and physical activity.

Have a project with complex integration?
The Purrweb team knows how to work with devices, protocols, and architectures where there are no ready-made solutions and innovation is required.
Contact us — let's solve an engineering challenge together

The results

As a result, we created a mobile app that simplifies the crucial task of glucose monitoring. It requires no technical expertise and functions exactly as users need it to on a daily basis.

Here's what we achieved:

❤️ Stable sensor connection

The app reliably receives data every 5 minutes, automatically reconnects, and maintains a steady data flow. For users, this means one thing: readings are always available.


❤️ Convenient and clear interface

We built UX that works for people of all ages and digital literacy levels. The onboarding process is simple, the sensor connection is step-by-step, the charts are clean, and the diary is quick to use.


❤️ Offline functionality

Freelife stores data locally and synchronizes it when a network connection becomes available. This feature is especially useful for people who are often on the go, in elevators, or in areas with poor connectivity.


❤️ A chart you can trust

We fine-tuned the visualization so that users can see the real dynamics. The chart has become a helpful tool for understanding their condition.

We established a foundation of architecture and UX that allows the product to evolve without compromising core stability. The app is ready for expansion. Family scenarios, lab results, complex diary entries, redesign, and support for new sensor models can all be added gradually and safely.

Most importantly, the client received a working MVP on time. The app fulfills its core purpose of helping people track their glucose levels and record important daily events without stress. Thanks to the stable foundation, the Freelife team can confidently plan the next stage of product development.

Содержание
Looking for a development team?
We can help with design and development of apps for businesses and startups
10 years on the market
550+ projects

Similar posts

Unexpected Outcome of the App Redesign. Trueflutter case
Doctor appointment app development: features, benefits & costs
App wireframes: a cornerstone of your project or an extra headache?
Guide to Medical Software Development
No items found.