
Management metrics
The project’s success hinges on an effective development process. The budget, development time, and priority features should all be chosen and adjusted based on actual figures. Management metrics help software development companies assess how the team is doing.
Burndown rate
A central management software development metric, the burndown rate, is a chart that displays the ratio of completed work to that of remaining. This rate shows data for:
-
- a particular sprint in a sprint burndown chart,
- the entire project in a release burndown chart.
The chart has two lines that represent task completion progress. The X-axis counts the number of days to the sprint end or a release; the Y-axis is the tasks to address. One of the lines shows the expected progress, the other — real progress. Here’s a chart example:
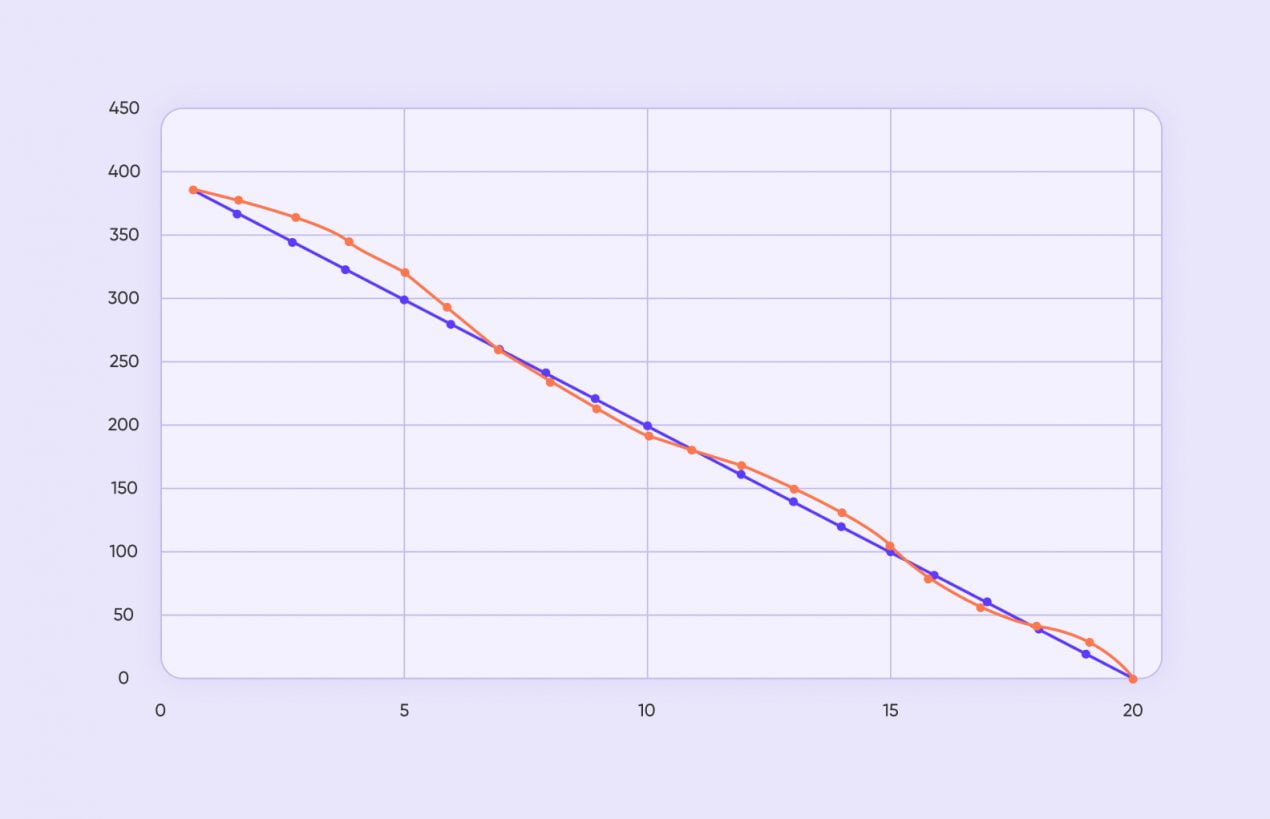
If the line of actual performance tilts steeper, work proceeds faster than expected. If it is more horizontal, the process is dragging. The graph can bend as well. It may flatline in idleness for some time when there are no tasks and then drop down when the software development company is hammering away.
🎯 The burndown rate chart can give a perspective on:
-
- whether the team can complete all of the sprint tasks on time,
- whether a release can meet the deadline,
- the current stage of the project,
- the team’s ability to work to plan,
- reasonable timeframes.
Want a real case where the burndown rate has been useful? Here is one of ours:
Flow efficiency
In custom software development, there are stages of active work and idle time with lacking information or resources. Cutting down on this downtime is one of the managers’ responsibilities. Taking the actual time worked and dividing it by the total time, we get what is called flow efficiency.
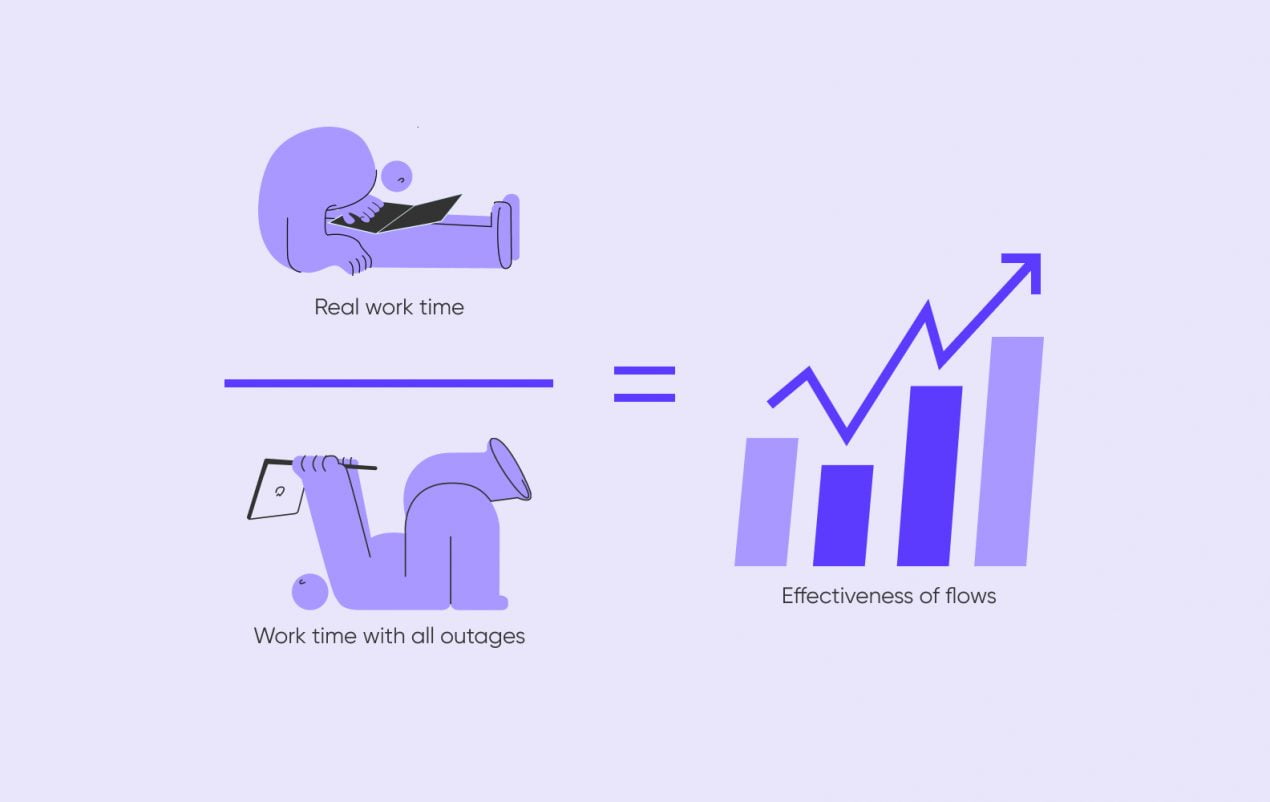
For example, the team worked on a task for 3 days after waiting for 2 days to get the required resources or resolve blocking issues. The flow efficiency, percent, will be 3/(2+3) *100 = 60%.
🎯 This software development metric serves to:
-
- display how much idle time is there and whether it’s a problem for the project,
- optimize software development outsourcing by monitoring the progress.
Team velocity
The next software development metric represents the scope of work the team can fit in a sprint. To calculate a team’s performance, product developers use “story points” that range tasks depending on their complexity. When you work with a partner software development company, they only measure tasks in hours, which is more intuitive all around.
The sum of story points or hours in a sprint represents overall performance.
🎯 This metric is used to help managers understand a few things:
-
- whether the current team can deliver the product on time or the project requires more human resources,
- the number of tasks they should plan in the following sprints,
- the changes in the work process influence the team’s performance,
- the release date that suits this development speed and capacity.
Average bugs per sprint
There is no avoiding software “bugs” when coding. To get some command over them, managers can count the issues in every sprint. With a few sprints as samples, one can set expectations for an average number of bugs in this project. When there are considerably more or fewer bugs in a sprint, it is a cause for concern.
🎯 Here is how the bugs per sprint measure to be interpreted:
-
- If there are too many bugs, something has gone off course in the development, and the team needs to find the source of these constant errors.
- Very few bugs might also be a problem. Perhaps the testing was insufficient.
Technical metrics
This group of software development metrics is a crutch for programmers to lean on. The indicators to be considered here also showcase the product performance and quality. For quality management, ask your development team to show the technical metrics before every release.
Test coverage
This stands for the percentage of software code tested. If 78% of the code has been tested, that will be the test coverage figure.
🎯 To software development companies, the indicator can tell:
-
- whether there has been enough testing,
- how likely some glitches are to slip into the release undetected.
Page loading speed
A fundamental software development metric, the loading speed, has a lot to do with the viability of a product. Users will eventually give up on slow-loading pages, and the company will lose money. Unoptimized code, too many redirects, and “heavy” multimedia content are some of the reasons behind the slow loading speed.
As the loading speed is measured by several aspects and factors, it usually makes sense to split this statistic into smaller metrics:
-
- first drawing time — when the browser shows the first blank page,
- first content loading — any picture or text popping up,
- first important design loading — the essentials appear, e.g., product information,
- time to interactivity — the first button to click on,
- first user interaction to system reaction — how quickly the system responds to input,
- complete loading time.
🎯 This set of software development metrics gives an idea about:
-
- pages’ (in)adequate loading speed,
- bottlenecks and what to do about them, like shortening the code or compressing the content.
ER chart
An ER chart represents a database. It shows connections between different elements inside the database. The chart has various geometric shapes with lines in between. The shapes are entities or objects and concepts, and the lines represent the actions.
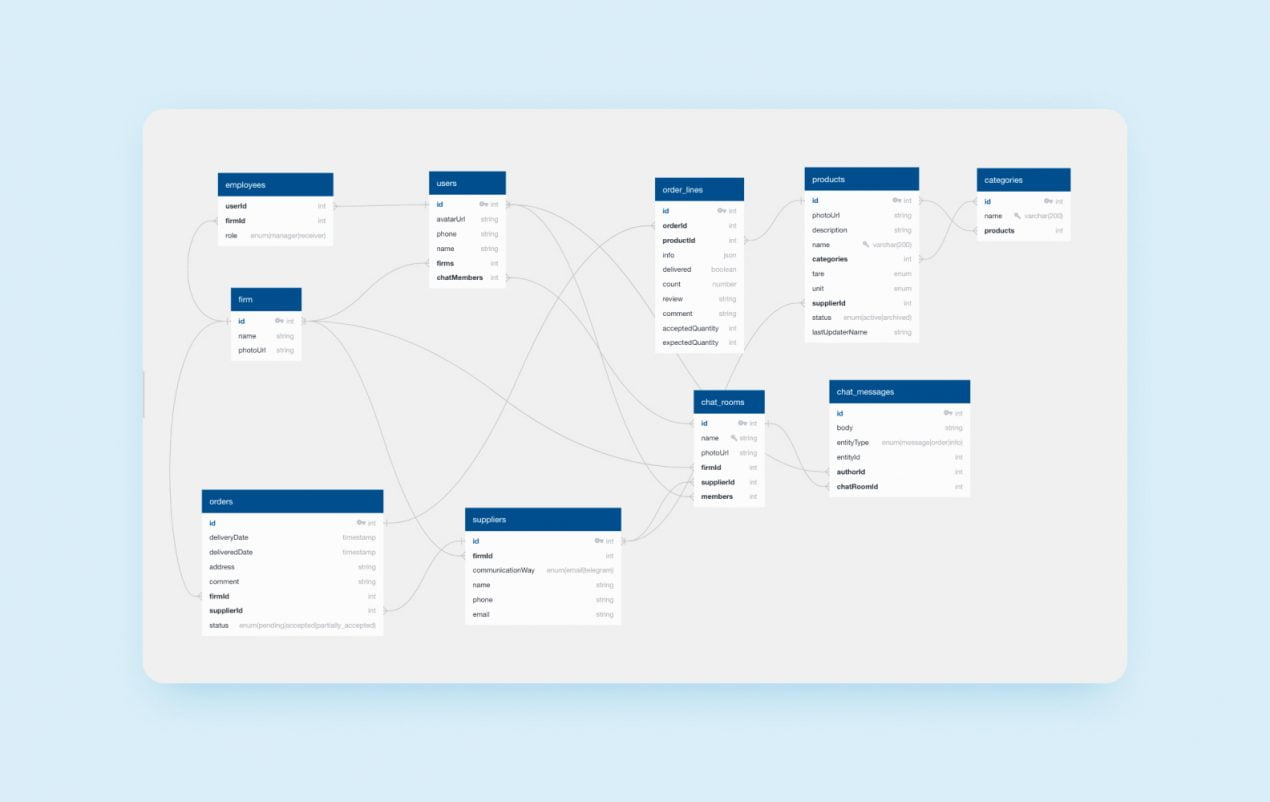
This chart helps translate clients’ ideas into software logic. A software development company uses this chart to visualize the input data from a client.
🎯 If this chart does not make any sense, then perhaps:
-
- the developers did not understand the business task and needed to come up with a different logic structure,
- the client’s requirements are impossible, and one should look for common ground.
Framework selection
A framework is a platform with ground-level software modules over which the development team builds up an application. It serves as a foundation of the project’s architecture, and as such, it influences the rest of the structure. A dubious and poorly chosen framework can cause all kinds of problems, while a high-quality platform supported by big names like Google or IBM simplifies development and brings tools to deliver high-quality products.
🎯 A good framework:
-
- speeds up development,
- lowers costs,
- ends up enabling cleaner code, which means trouble-free performance and quick webpage loading.
For mobile apps, Purrweb chooses ReactNative, a JavaScript framework supported by Facebook. Unlike other technologies, ReactNative can save clients up to 30-35% of time and budget when developing applications for iOS and Android.
Code duplication
This indicator should always be considered in custom software development. Code is low-quality when it has many duplicates. Such code takes up more lines and more processing resources and works slower. Sometimes, the code is duplicated for development tasks, but we mean accidental duplication. There are services that automatically scan uploaded code for repeating fragments like Sonarqube.
There are many more technical software development metrics that are useful for IT professionals only. Startups can delegate the technical monitoring to the company’s technical director or a third party if they opt for software development outsourcing. Our technical metrics list should be of some help if you want to do it yourself. Now, let’s move to a group of metrics that is easier for businesses to understand.
User metrics
In the end, everything that software development companies do, they do for users. Their convenience and satisfaction are vital parameters that indicate future profit for the business.
Customer satisfaction score
CSAT measures the quality of a single interaction with a service. To get the score, we ask a user a small question about one thing. For example, we ask to evaluate how simple the navigation was by choosing between “good,” “bad” and “neutral”. Some other questions to ask: How was the delivery tracking? Are customer loyalty program terms clear to you?
The result may not illustrate this user’s loyalty in every respect. They might have hated the rest of the service but loved this particular snippet of it. For target, single-aspect probes, though, CSAT is helpful.
🎯 This may be valuable for:
-
- assessing key functionality, e.g., in the case of an e-store, it is important to know if the users are content with the catalog format and the payment system,
- analyzing new features, which may be innovative or simply unusual for this segment of the audience,
- checking the results of a redesign to compare with an earlier reception of the feature.
Net promoter score
The NPS metric is taken from users’ responses to the “How likely are you to recommend this service to your friends and acquaintances?” Usually, people are invited to grade it from 1 to 10.
Unlike CSAT, which shows satisfaction with a particular feature, NPS measures overall loyalty to the app as a whole for the entire period of use.
🎯 The purpose of NPS is to divide users into segments:
-
- very loyal and ready to recommend,
- not certain or indifferent,
- repulsed and dissatisfied by the product.
Retention rate
Software is supposed to be used for some time, so a permanent or lasting audience is important to the business. Depending on the product, this metric may be taken on a daily, weekly, or monthly basis.
🎯 Retention rate figure lets companies know several things:
-
- how often users need the app at all,
- for what services users turn to the product and how frequently,
- after redesigns, changes of content, or promotions, to check how the modifications influence retention.
Conversion rate
This software development metric reflects the share of users who have performed the target action: subscribed, bought things, or clicked on them. The rate is a percentage. If 20 people out of the 200 page visitors per day have clicked on the button, conversion is 10%.
🎯 The purpose of this indicator is nothing other than to find out how attractive the CTA element is to the traffic. If the conversion is low, the company can start looking for reasons behind it, such as:
-
- problematic marketing, price or quality, no reviews, an uninterested audience drifting past the goods, service, or content,
- functionality issues; maybe, the order payment page takes too long to load for the easily exasperated customers,
- design flaws, perhaps, something so simple as a hard-to-find button.
Adoption rate
This follow-up metric shows how many users continue using the product and whether they use all of the functions, just a few, or one. By dividing the number of people who use a particular feature by the number of all users, we get this statistic.
🎯 The rate suggests:
-
- What features are popular and what are not,
- where users might benefit from onboarding (hints),
- after extending the functionality, to check whether users are interested in the additions.
What now?
Software development metrics are a tool for managing the IT business processes from different perspectives: management, technology, and user experience. We’ve looked at the indicators that are important for every startup.
Among the hundreds of known and infinite conceivable numbers, there may be vital parameters that you should keep an eye on based on your specific product. For this reason, we recommend startup owners obtain the services of analysts to avoid problems from the get-go.
Purrweb starts monitoring indicators from day one and adjusts the development direction to provide better quality in a shorter time. We are always ready to provide you with custom software development services and advise you on all aspects of the process. Contact us and find out which software development services we offer.