Explore

Need help with your project?

Oops! Something went wrong while submitting the form.
Our clients were a stun gun manufacturer that produces Gard, Magen, and Lumos stun guns for police officers & guards in three countries. They requested to design and develop a desktop app that would analyze data collected by the stun guns.

They had a functioning prototype with a WindowsXP-style UI. It was enough to check the feasibility of the idea. Still, only an easy-to-use interface could make the app actually valuable for stun gun owners. So, we redesigned the entire UX and created a trendy and catchy UI.
A wire connects a stun gun chip and a computer. This way, the app reads the shot data recorded by the stun gun. This information may prove a person guilty or innocent. Every time a user shoots a stun gun, the chip records the discharge time, duration, and power.

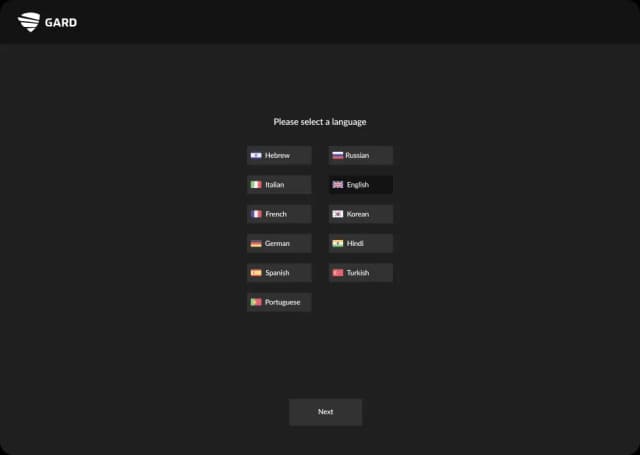
selects a language and logs in with a username they receive from an administrator via email
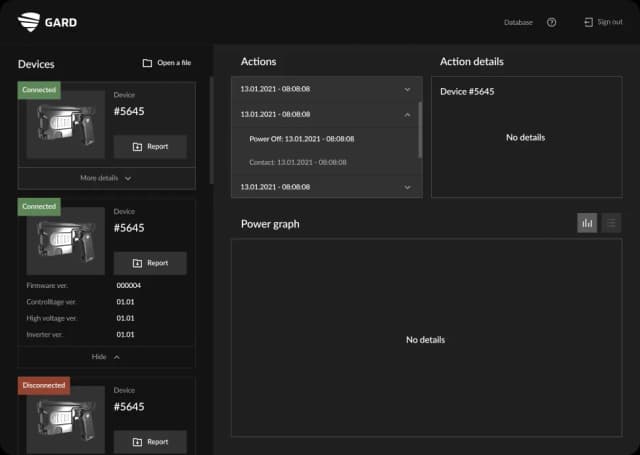
sees a list of devices, opens one of them
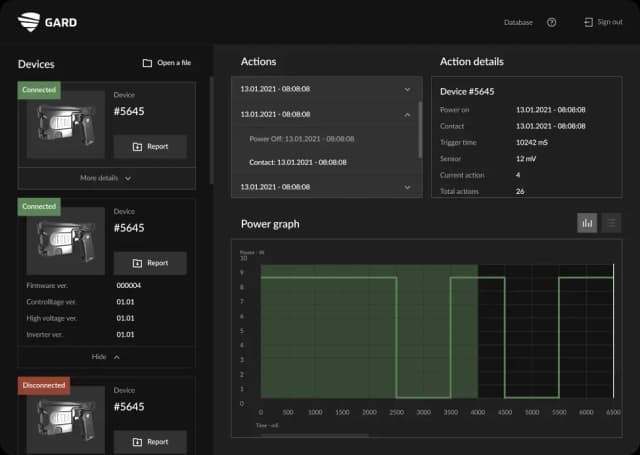
gets a detailed report: the discharge time, duration, and chart.
The demo was short as we got only three
comments:


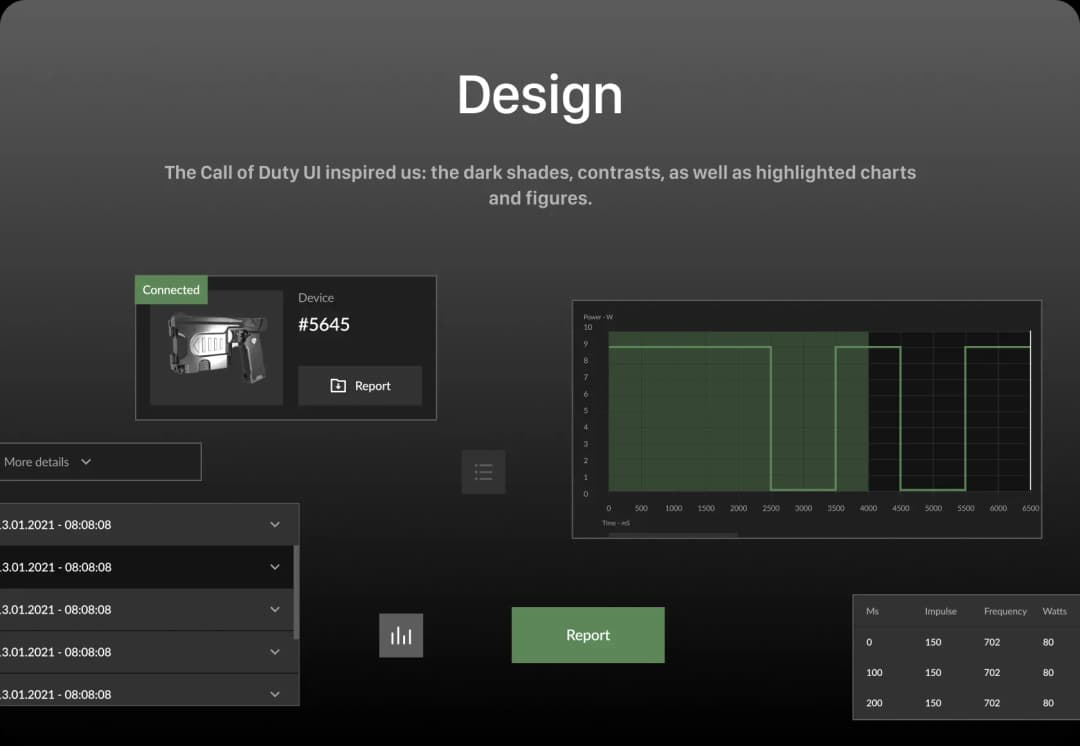
The clients had no typography, so we were free to select a typeface. We chose Lato, as it is neutral and goes great with any UI.
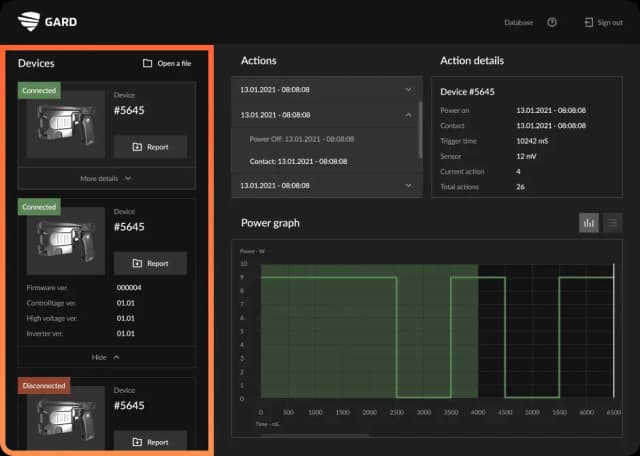
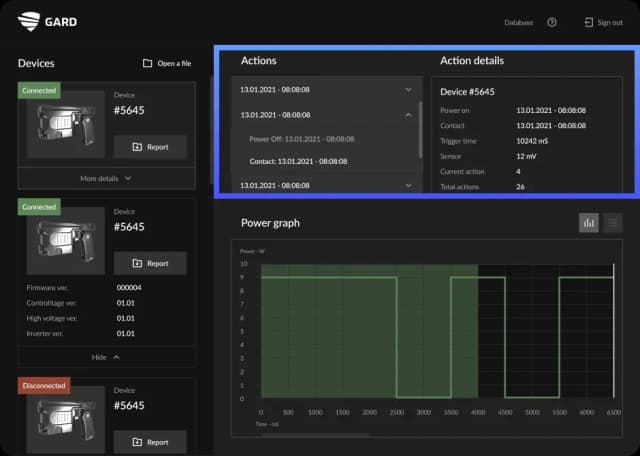
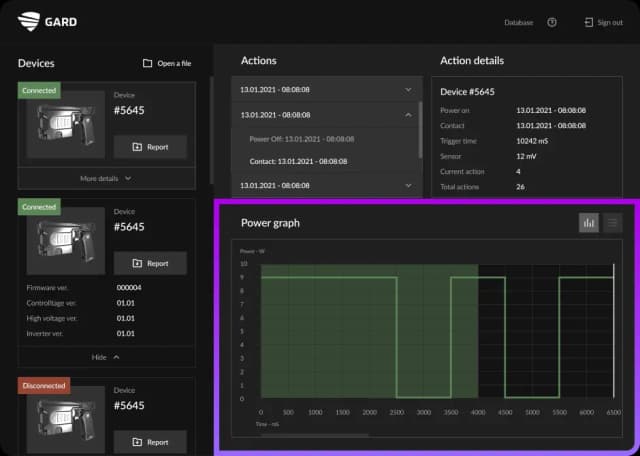
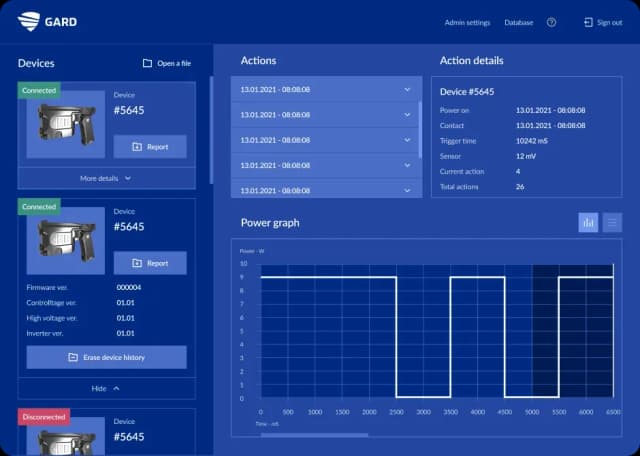



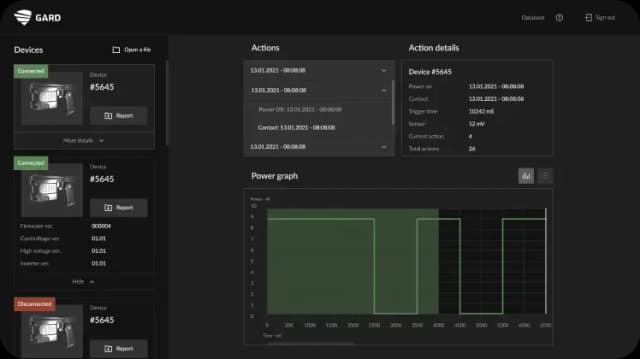
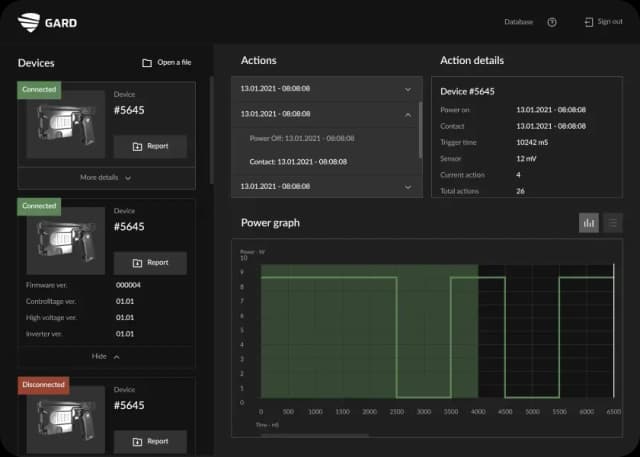
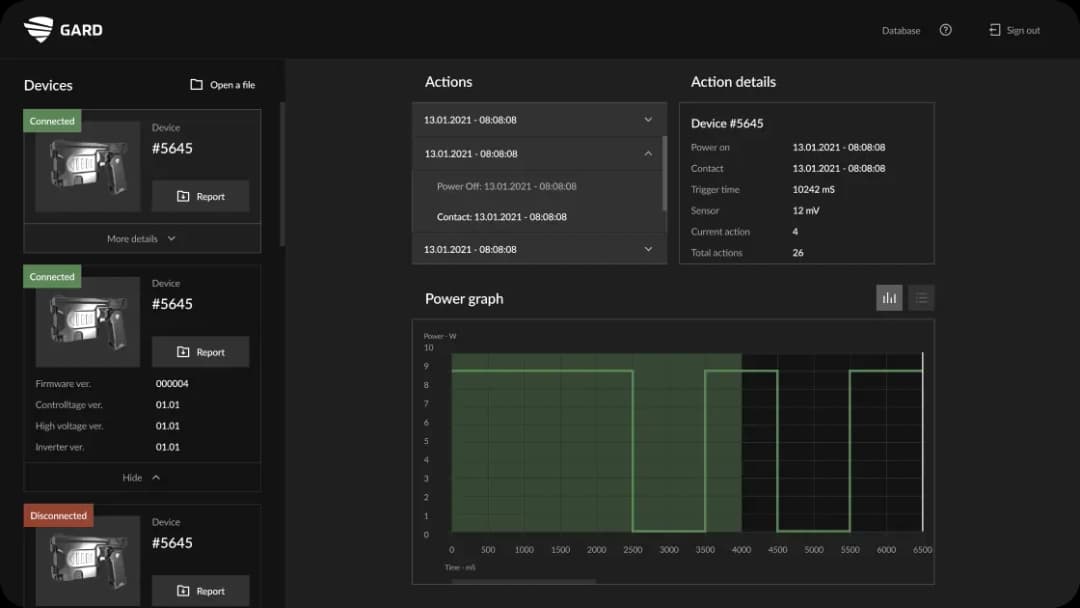
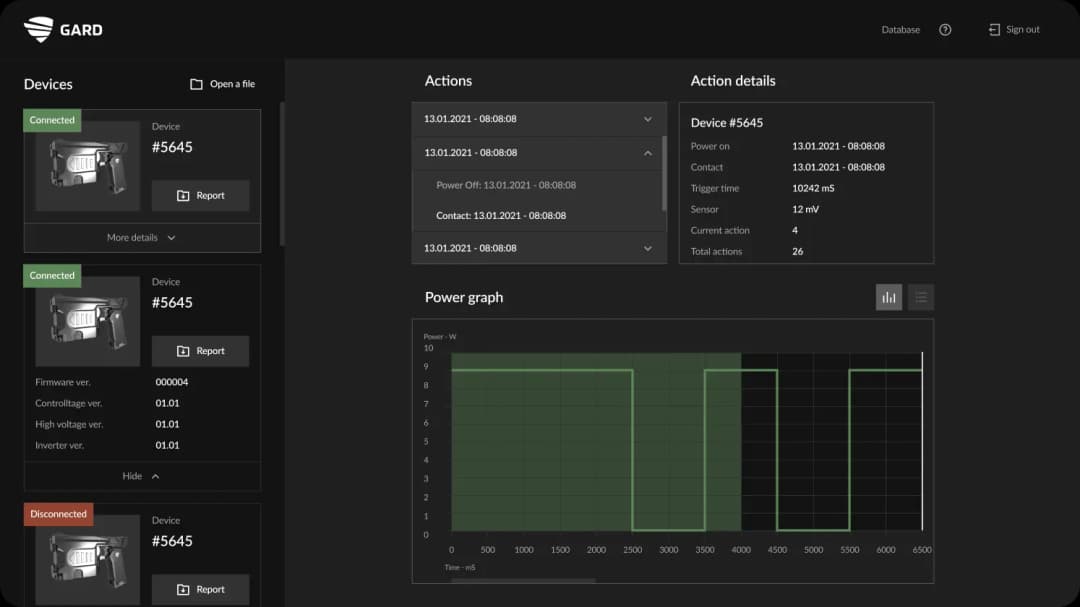
The UI comprises three blocks: the device, shot details and a discharge chart. This structure enhances navigation. It takes a user only two clicks to view a discharge chart.
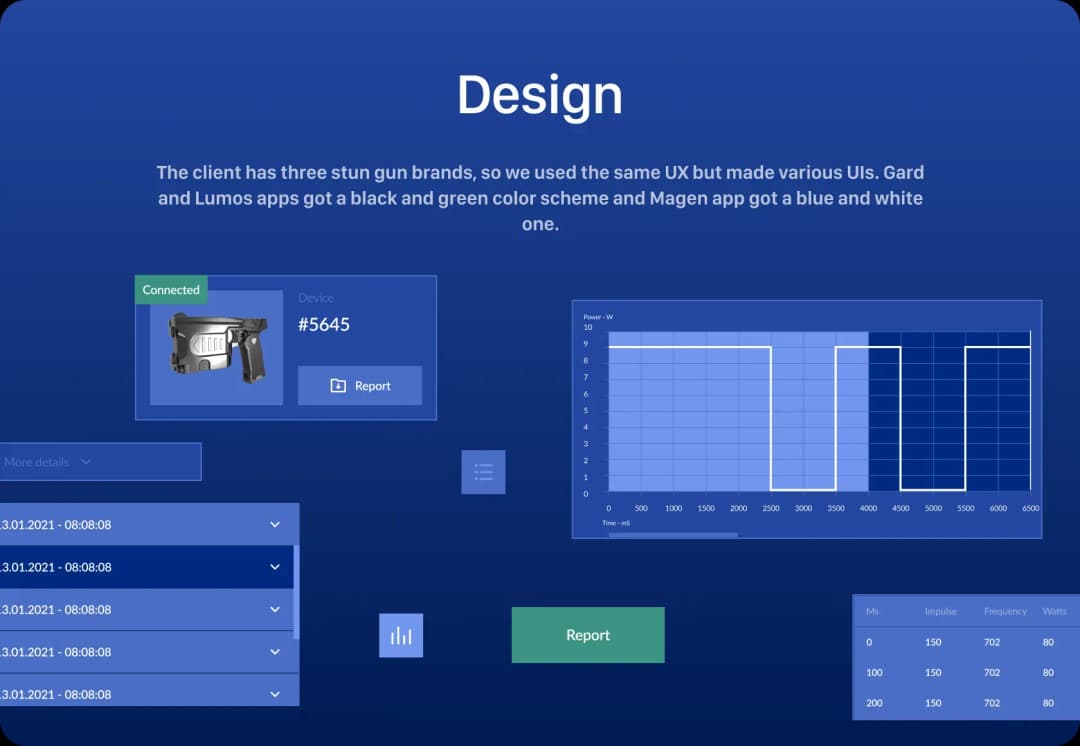
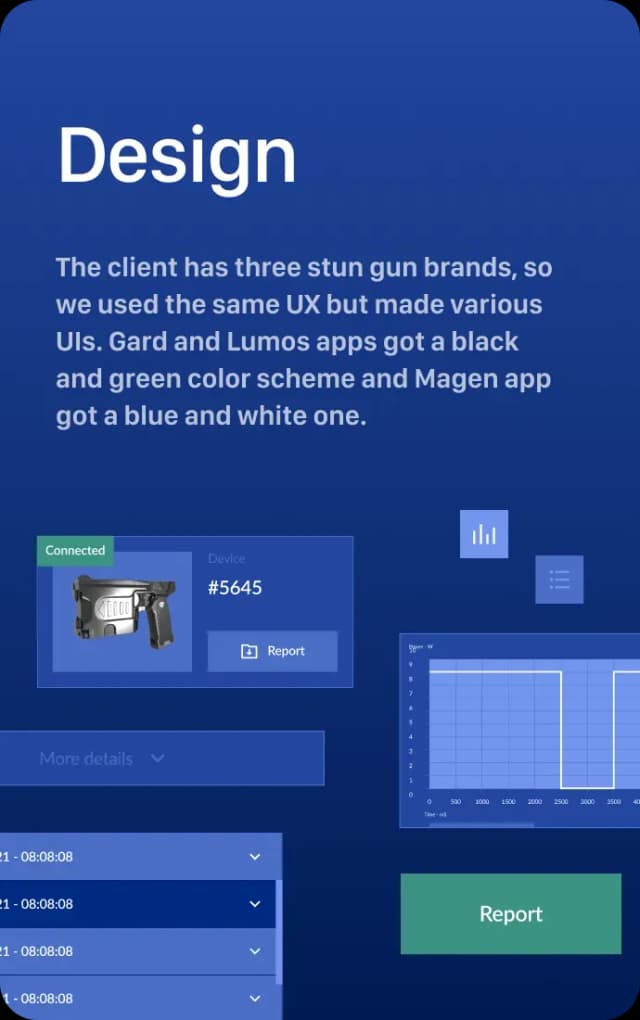
The clients wanted to have green lines on the blue background. We suggested going with white instead to enhance the contrast. As a result, the diagram is easier to read.
Of course, we developed a responsive design for the app to function correctly on devices of different sizes.



We chose Electron.js to develop the apps. It saved our time and the client’s money: we wrote one code, but got three apps — for Mac, Windows и Linux.
We chose Electron.js to develop the apps. It saved our time and the client’s money: we wrote one code, but got three apps — for Mac, Windows и Linux.
We asked the client to send one stun gun for testing all the possible cases. They sent us
just a chip that was enough to test the key functions.
The chip is connected to the laptop with two wires. One of them kept disconnecting, so our project manager found his father’s old soldering iron and had to refresh his memory on how to use it.
Our clients have received the completed app, and they are thrilled. Now they are changing the stun gun cases. Soon they will release the first set of stun guns so the app’s time to shine is coming soon ⭐️