Explore

Need help with your project?

Oops! Something went wrong while submitting the form.
Fintech data analytics is the practice of collecting and modeling financial data to detect fraud, score credit, and drive real-time decisions. Inside a product, it turns raw transactions into insights the app acts on by itself, from approving a loan to flagging a payment. It isn't a dashboard bolted on after launch. In fintech, analytics sits in the core product, and in how the company makes money.

This guide is for founders, product owners, and CTOs building or upgrading the analytics inside their fintech product. It covers the four types of analytics teams run, the use cases that drive revenue, a reference tech stack by stage, and what a build costs.
At its core, fintech data analytics collects financial data across a product and turns it into decisions the product makes automatically. It scores a borrower, flags a payment, or reorders a feed. The same pipeline that powers data analytics in financial services for reporting also handles transaction data. It feeds the model that approves a loan in the moment.
That last part is what separates it from ordinary business intelligence. Financial technology firms already lead here: they make up about 40% of the market yet drive roughly 70% of artificial intelligence (AI) initiatives in finance. The gap from a bank's BI stack comes down to three things.
Traditional banking BI looks backward. A data analyst pulls last quarter's numbers into a dashboard, and a human reads them days later. Fintech analytics runs the other way.
First, it's real-time. A payment is scored for fraud in milliseconds, not reviewed overnight.
Second, regulation is built in. Any model touching credit or payments has to explain its decision and leave an audit trail, so compliance shapes the architecture from day one.
Third, the data is more sensitive and more varied. Card details, KYC documents, and device signals all feed one pipeline. That is why big data analytics in fintech is a security question as much as an engineering one. The payoff is actionable insights the product uses on its own.
Big data in fintech is real money, not hype. Big data analytics in banking is worth around $30.7B in 2025 and is on track to nearly double by 2030.
Fintech analytics comes in four layers that build on each other, from reading the past to acting on the future. Most teams start with the first two and grow into the last two as data volume and stakes rise. It mirrors how businesses use big data in general, applied here to money in motion.
Most products don't run all four at once. A seed-stage fintech can live in descriptive and diagnostic for a year, then add a predictive fraud model once volume makes patterns visible. The point isn't to race to the top layer. It's to know which one earns its cost at your stage.
The higher you climb, the more clean data and compute each layer needs. Predictive and prescriptive models are advanced analytics that lean on big data analytics, and often real-time analytics. A fraud score is worthless if it lands a minute after the payment clears.
This is where analytics stops being a report and starts making money. Each use case below turns a specific kind of data into a decision the product acts on, and most of them either cut a cost or open a revenue line. Here are the six that tend to pay for themselves fastest.
Real-time fraud detection scores every swipe and transfer against the user's normal behavior: location, device, amount, time. It holds anything off before the money moves. This is machine learning in fintech at its most direct: models trained on millions of rows of historical data, retrained as fraud shifts. The hard part is blocking theft without adding friction.
We built Broex, a multicurrency crypto wallet on a European license, where the trust layer runs before a user ever sees a balance. Onboarding routes through SumSub identity verification, and biometric login with Face ID or Touch ID guards every session after that.
Putting KYC and device checks up front means fraud signals are collected at the door, not patched in later. See the Broex case.
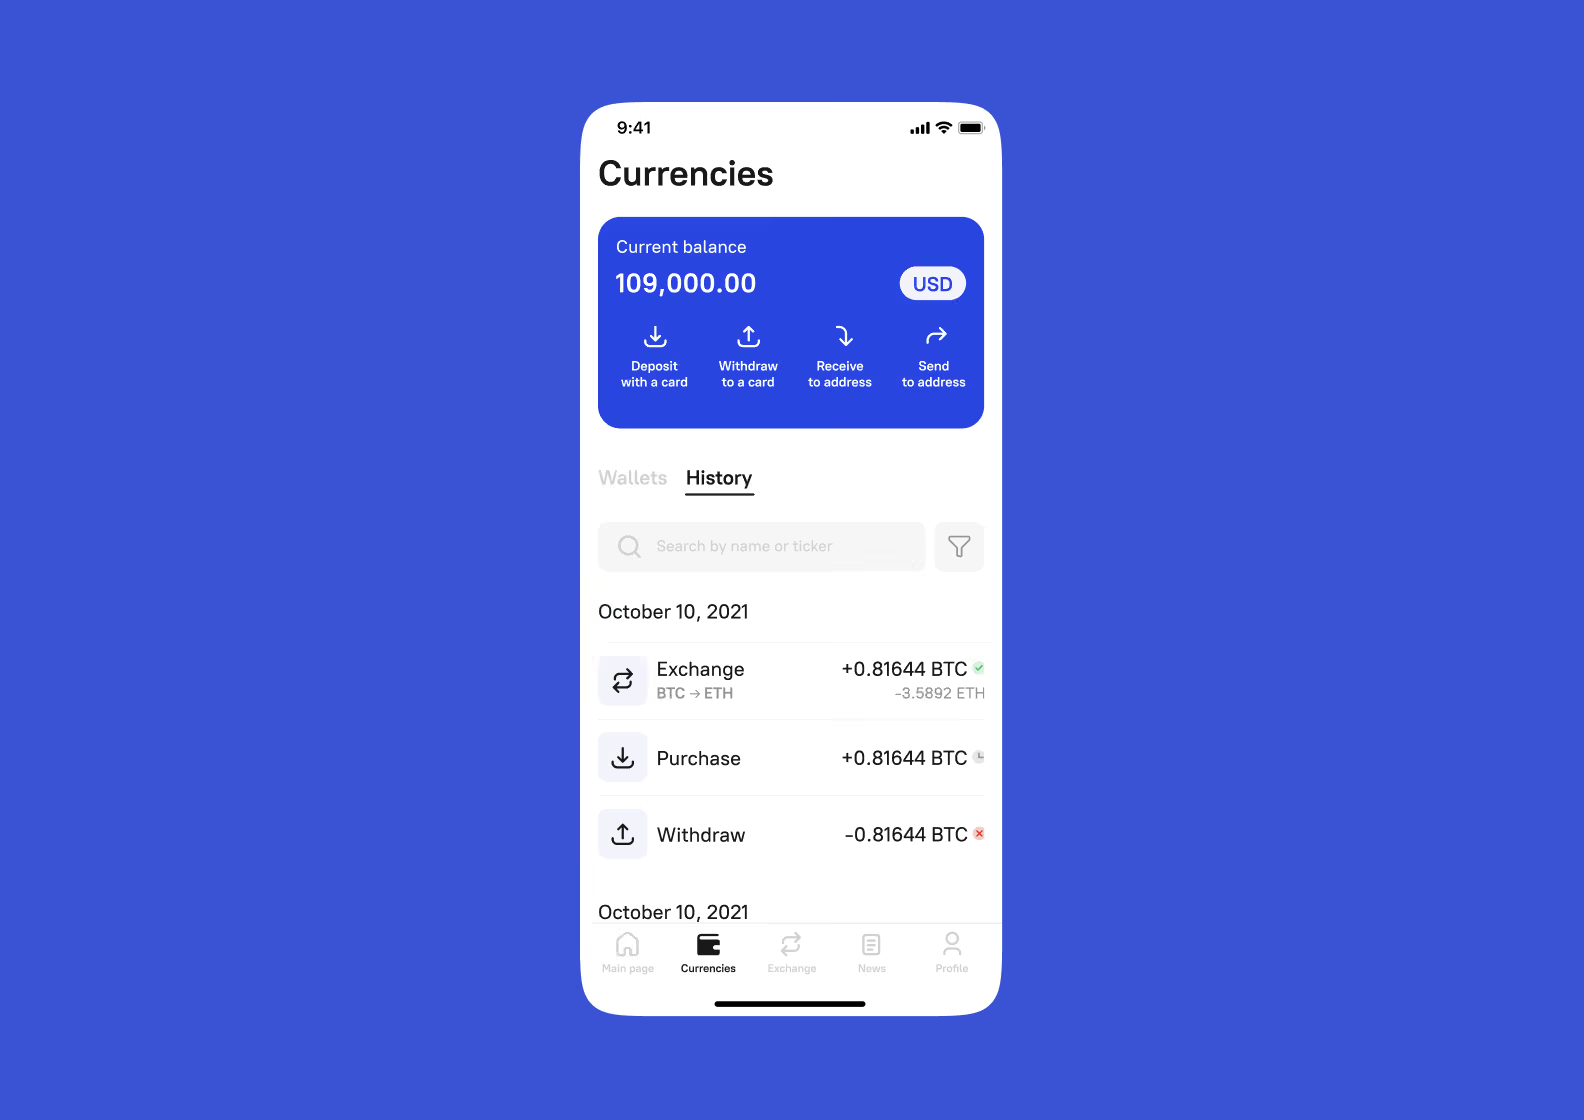
Identity and device checks sit in front of the wallet, so risk data is captured before the first transaction
Bureau scores like FICO miss thin-file borrowers. Credit scoring built on alternative data, like rent or cash-flow history, approves people those scores reject. The risk stays measurable. This is predictive analytics in fintech: the model estimates credit risk, and the product prices from it. Done right, it widens the funnel without raising losses.
Behavioral data predicts who is about to leave. A drop in logins, a stalled transfer, or a fresh support ticket each nudges a churn score that triggers an offer or a check-in before the user is gone. The same signals drive personalization: which card, which savings pot, which nudge fits this user now. Retention costs less than acquisition, so a model that saves five percent of at-risk users pays for itself quickly.
Money moving between banks, processors, and ledgers rarely lines up cleanly. Reconciliation analytics matches millions of transactions across systems, flags the mismatches, and shows finance where cash actually sits in real time. For a neobank or a payments product, that is the difference between a clean audit and a week of spreadsheet work. It also feeds the cash-flow forecasts the business plans against.
Compliance runs on data too. Anti-money laundering (AML) checks screen transactions against sanctions lists and known laundering patterns. They then file the reports regulators require. Automating this turns a team of analysts into a review queue: the system flags the suspicious few percent, people judge those, and the audit trail writes itself. It cuts cost and the risk of a heavy fine.
The last use case points the analytics at the user, not the operator. Embedded analytics puts dashboards inside the app: spending breakdowns, portfolio performance, cash-flow charts the customer actually opens. It works as a retention feature and a data flywheel at once, since every interaction feeds the models behind the other five use cases. For B2B fintech, it is often a paid SaaS tier on its own.
Not every fintech tracks the same thing. What counts as a core metric shifts by segment, because risk and money move differently in each. This is data analytics in the fintech industry in practice: the same toolkit, a different scorecard per segment.
The four segments below cover most of the market, and the table at the end maps each to its analytics type and key KPI. Younger fintech firms and established financial institutions both use it as a starting scorecard.
Lending lives on predictive analytics. Credit-scoring models decide who gets approved and at what rate, so the metrics that matter are approval rate and the default or delinquency rate behind it. A point of accuracy here moves the whole loan book.
Digital payments run in real time, so the analytics do too. Fraud scoring and reconciliation are the core jobs, and the numbers to watch are fraud rate, reconciliation time, and chargebacks. Slow reconciliation quietly ties up cash the business could deploy.
Wealth and trading products lean on prescriptive analytics: portfolio and investment models, plus forecasting that suggests the next move. AUM (assets under management) growth and a portfolio risk score are the headline KPIs. Crypto sits next door as a fast-growing vertical with its own token and engagement metrics.
We built Kaiju for Kaiju Labs in Singapore, a crypto wallet that folds blockchain games, an NFT marketplace, card top-ups, and a token economy into one app. Every integration stays inside a single secure flow, so reward, leaderboard, and wallet data all land in one place.
That shared data lets a Web3 product track engagement KPIs, like active players and reward payouts, the way a neobank tracks transactions. We shipped it in about two months. See the Kaiju case.
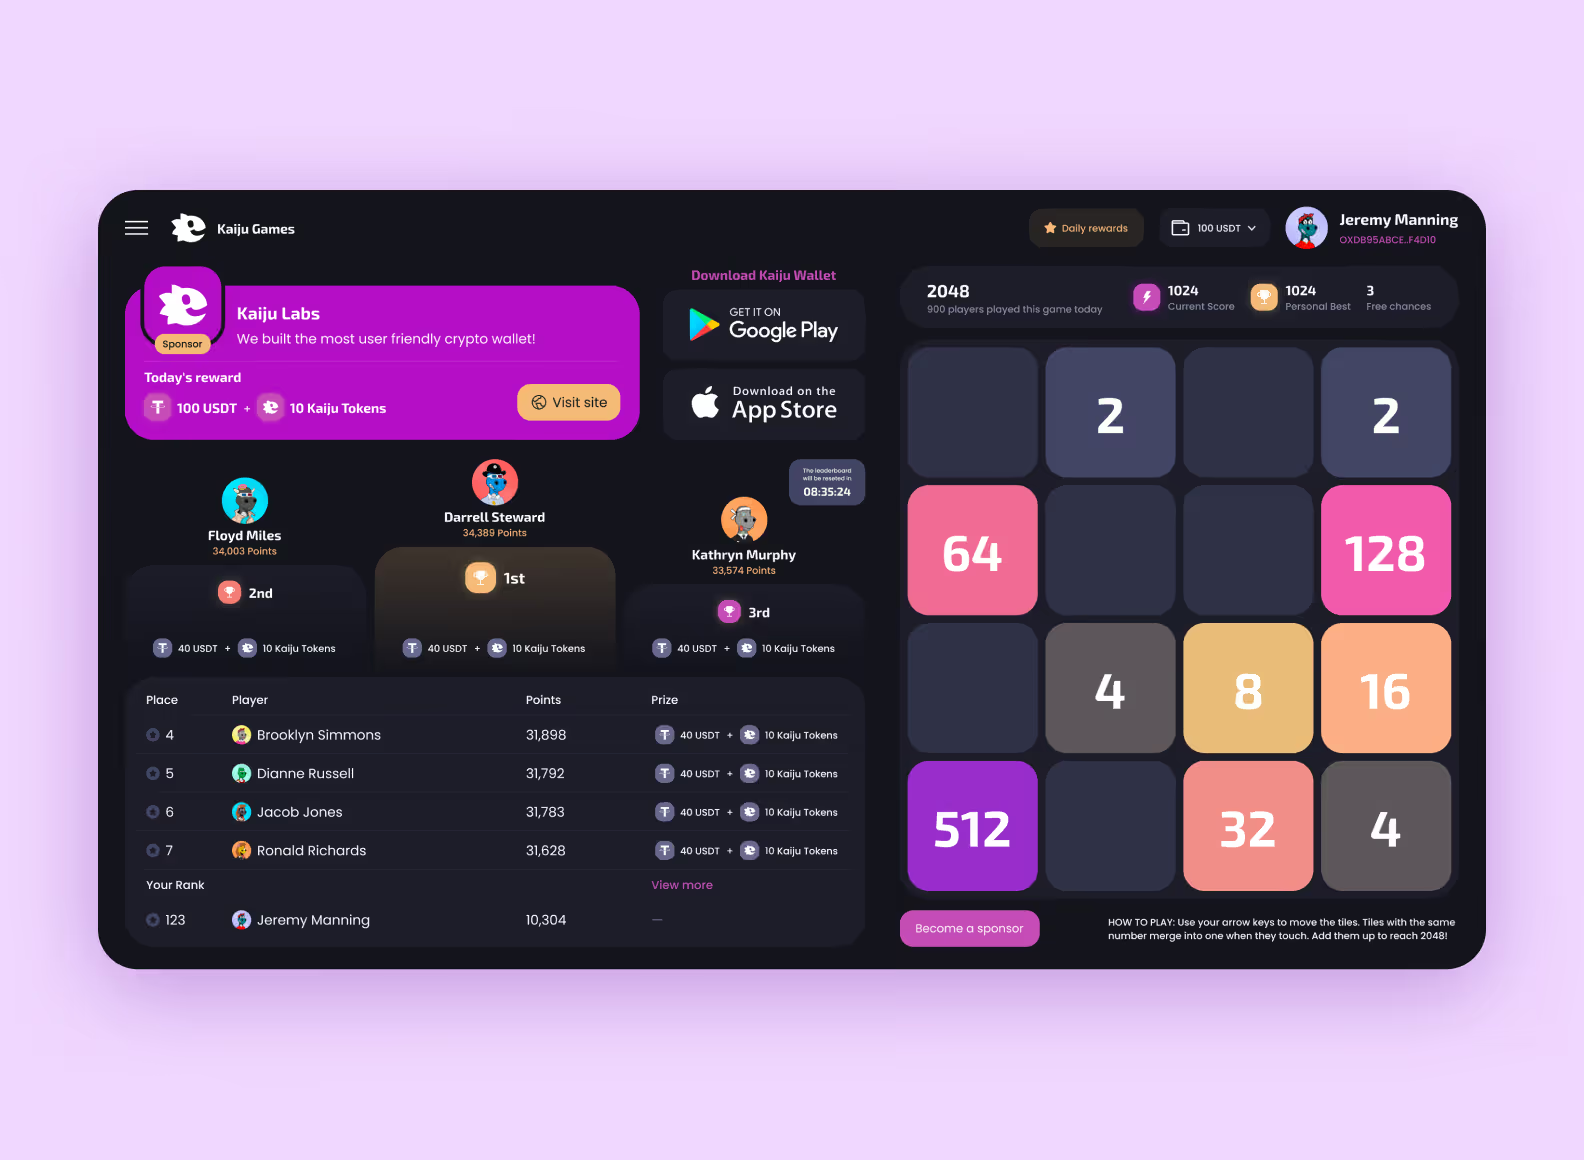
One secure flow keeps game, reward, and wallet data together, so engagement metrics come out of the box
InsurTech is a predictive game again, this time on the loss side. Churn models keep policyholders, and loss-ratio models price risk. Churn rate and loss ratio are the two numbers that decide whether the book is healthy.
Here is the same map at a glance:
| Fintech vertical | Primary analytics type | Key KPI to track |
| Lending / BNPL / P2P | Predictive (credit scoring) | Approval rate, default/delinquency rate |
| Payments & neobanking | Real-time (fraud, reconciliation) | Fraud rate, reconciliation time, chargebacks |
| Wealth management & trading | Prescriptive (portfolio, forecasting) | AUM growth, portfolio risk score |
| InsurTech | Predictive (churn, loss) | Churn rate, loss ratio |
Vertical scorecards differ, but a core set of KPIs shows up in almost every fintech analytics team. These are the numbers that turn dashboards into data-driven decision making instead of wall decoration. Five of them do most of the work: fraud rate, approval rate, reconciliation time, churn rate, and customer lifetime value.
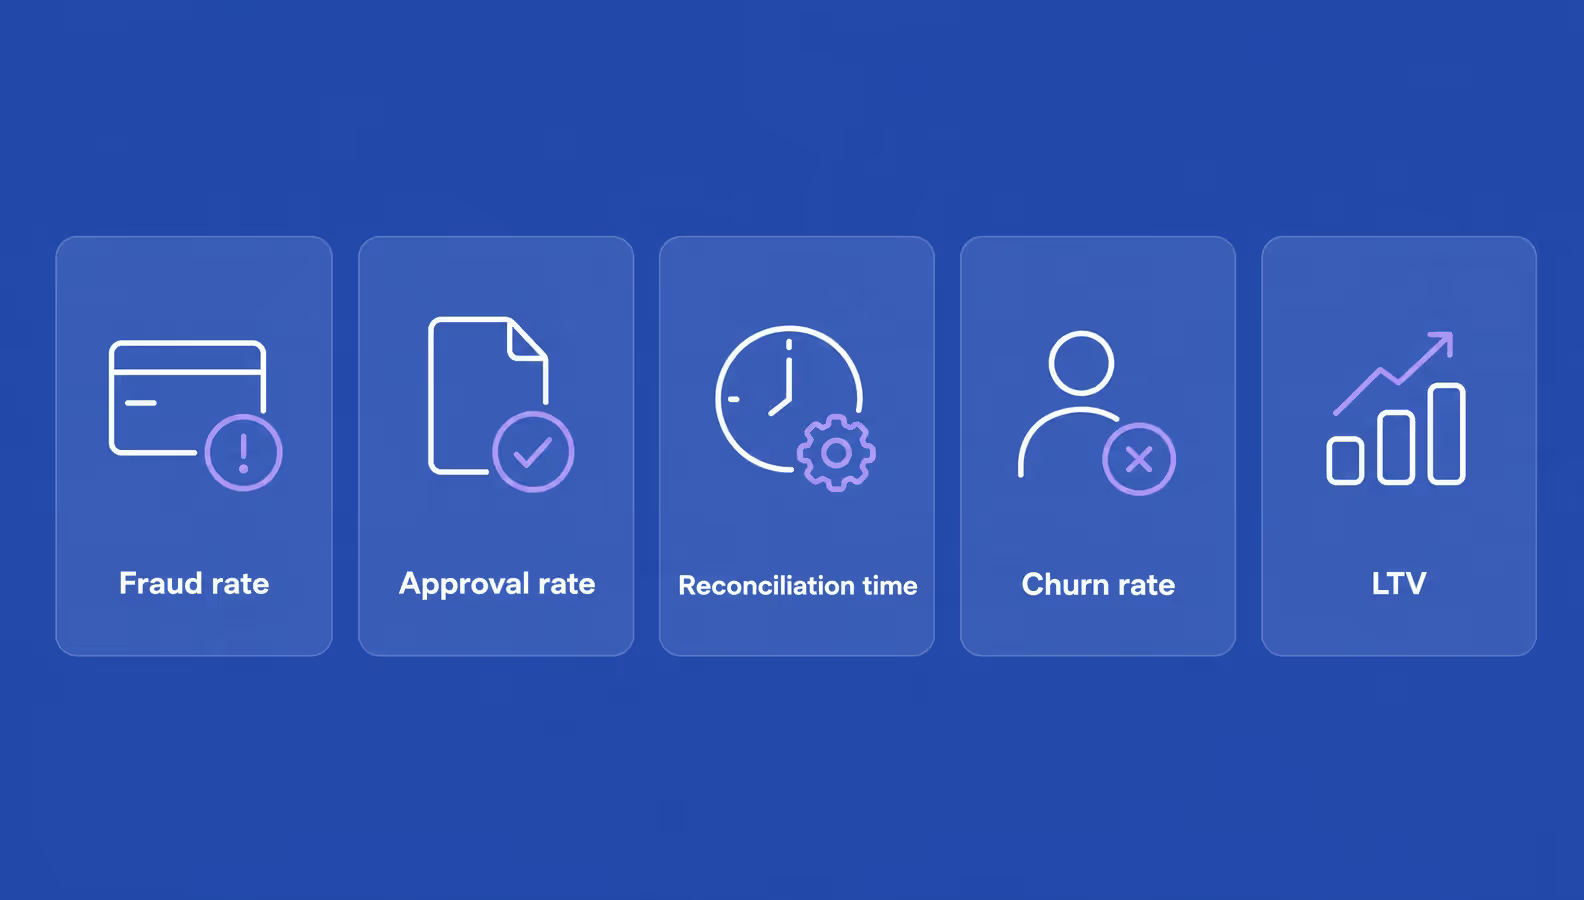
The five KPIs almost every fintech analytics team watches, whatever the vertical
None of these mean much alone. The value comes from watching them together and acting fast, since a rising fraud rate can drag approval rate, and a churn spike quietly cuts LTV.
Reconciliation time is the quiet one, a direct read on operational efficiency. Weekly review is fine for some. For fraud and approvals, the useful cadence is real time. That is where analytics turns raw data into actionable insights and real decision-making.
A fintech analytics build is a pipeline plus the storage and tools around it. The shape stays the same across products, even as the pieces scale. Three decisions define it: how data flows, where it lives, and whether you build the last mile or buy it.
Every analytics stack is a data pipeline with three layers. Data ingestion starts data collection, pulling millions of data points from transactions, app events, and third-party API feeds into one place. It runs in real time or in batches.
Then processing cleans, joins, and models the raw input, the real work of data analysis. It turns structured data like card records and unstructured data like support chats into a clean data model.
Data visualization is the last layer, where the output becomes a dashboard, an alert, or an automatic decision. Most early bugs live in the first layer. If ingestion is messy, everything downstream inherits it.
We built a big-data analytics system that pulls from 13+ external sources into one pipeline, then models the links between records in a Neo4j graph database and searches them through Apache Solr. The result replaced slow manual checks and ran about 20 times faster.
The lesson carried into every fintech build since: the pipeline, not the dashboard, is where the hard engineering sits. See the full big-data build.

Thirteen-plus sources feed one pipeline, so the graph and search layers work from a single clean dataset
Where your data storage lives depends on what you ask of it. A data warehouse stores clean, structured records for fast queries, which fits most fintech startups. Data lakes hold raw and unstructured data cheaply, useful once you train models on logs, documents, or clickstreams.
Real-time systems sit alongside both for fraud and payments, where a decision can't wait for a nightly batch. Nearly all of it now runs on cloud-based analytics, so you rent scale instead of racking servers. Start with a warehouse and add the rest as the questions get harder.
Not every layer is worth building. Off-the-shelf analytics tools handle dashboards, and embeddable products drop charts straight into your app. Build custom when the analytics are the product, like a fraud engine or a credit model that is your edge. Buy when they only support it, like an internal reporting dashboard. A useful rule: build what a competitor can't copy, buy what they already have.
In fintech, compliance isn't a checklist you run after the build. It decides how the analytics architecture is shaped in the first place. PCI-DSS (the card-data security standard), GDPR, and SOC 2 each limit where data goes and who can touch it. Designing for them early is far cheaper than retrofitting.
Three constraints show up in almost every fintech analytics stack:
Identity sits underneath all of it. Know your customer (KYC) checks feed the same pipeline. Onboarding data and analytics data end up sharing one audit trail and one set of rules. For the full picture, see security in fintech.
Nobody quotes a flat price for analytics, because it rides on the rest of the build. What you can pin down is the factors that move the number and a realistic range for a first version. The figures below are indicative, not a quote.
Three things move the cost of data analytics solutions most. Data volume comes first, since a larger amount of data and higher throughput mean more data pipelines to build. Real-time versus batch is second, because streaming fraud scores cost more to build and run than a nightly report.
Compliance is third. PCI-DSS scope and data residency add architecture work before a single model ships. As one part of building a fintech app, a full fintech MVP often runs $50,000 to $150,000, with analytics a slice of that.
Timelines track the same factors. A basic analytics layer inside a fintech product means dashboards plus a first fraud or scoring model. That is realistic in the same few months as the MVP around it, and a sample fintech build runs about 19 weeks.
Production-grade real-time analytics, retrained models, and full compliance take longer and arrive in stages. The point is to ship the layer that earns its cost first, then expand as the data justifies it.
We built the MVP for KEM, a peer-to-peer payment app in Kuwait. The hard gate wasn't the code, it was passing a banking partner's security review before launch, which shaped how transaction and card data were stored and accessed.
After launch we handed the product to the in-house team in about a month. KEM went on to raise $1M in seed investment and pass 100,000 users. See the KEM case.
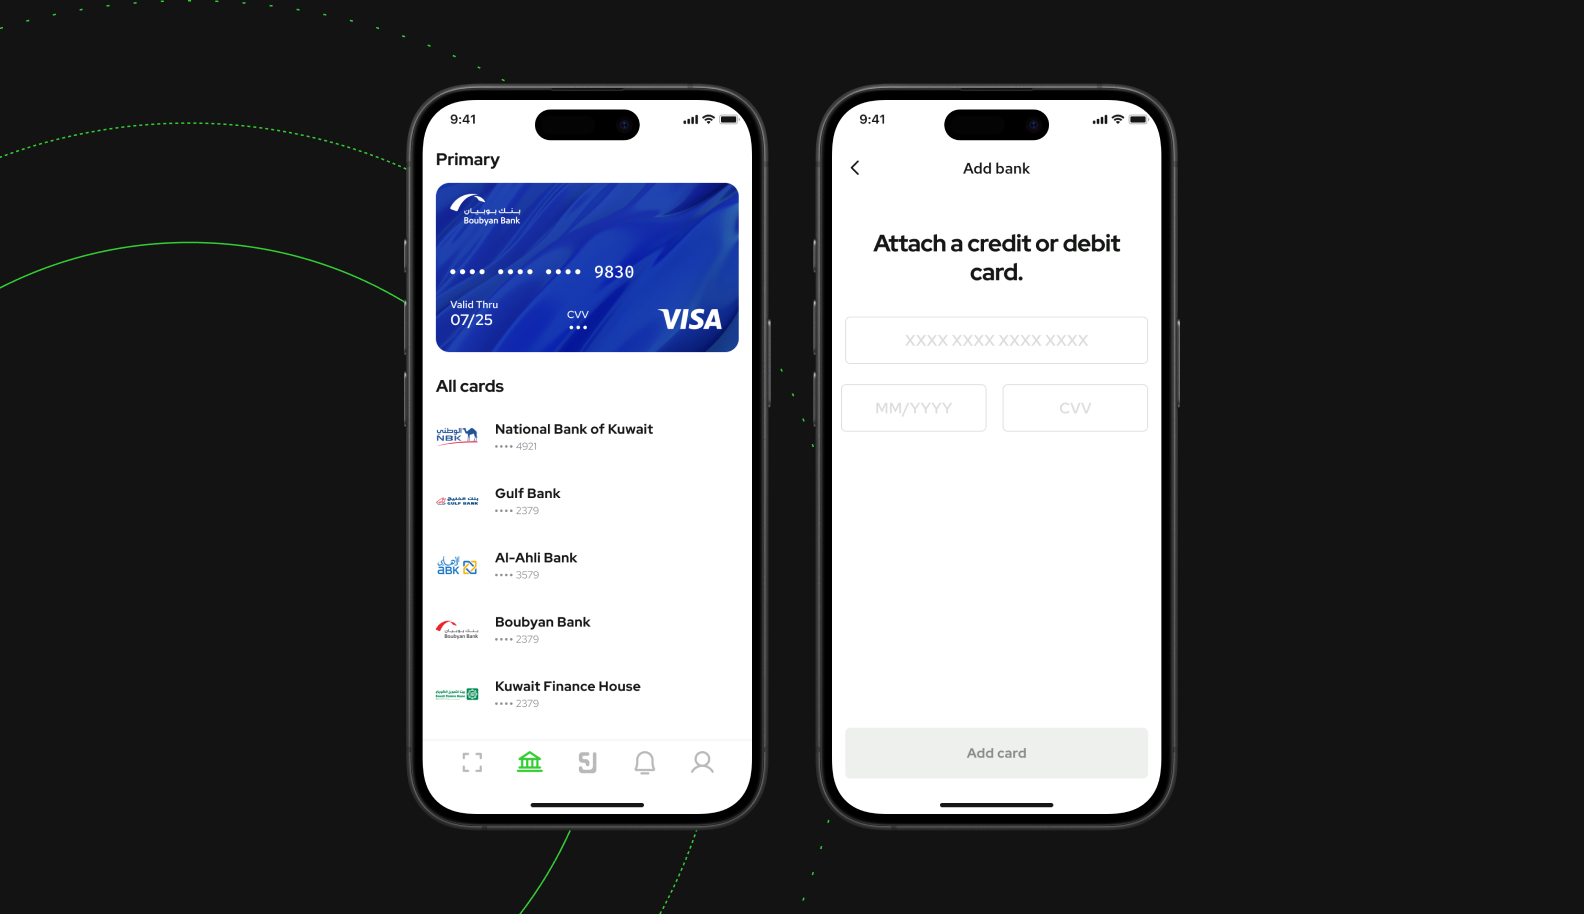
Passing the bank's security review up front set the data architecture, not the other way around
Most fintech analytics projects don't fail on the model. They fail on the plumbing around it, usually on data quality and the pipeline feeding it. Four problems come up again and again, and each has a practical fix.
| Challenge | How to overcome it |
| Poor data quality | Validate and monitor at ingestion instead of cleaning up downstream. Bad inputs sink good models. |
| Data silos | Use data aggregation to pull scattered data sources into one warehouse, so you see the whole user. |
| Hard integration | Standardize formats and complex data like documents at the processing layer, not in each report. |
| Scarce talent | A senior data engineer and data science skills are hard to hire, so start lean or bring in a partner who has built the pipeline before. |
None of these are exotic. They are the same four problems every data science team fights, just with money and regulators watching. Naming them early is half the fix.
The pattern across the cases above is the same. We start from the decision the analytics has to drive: a fraud hold, a credit score, or a dashboard the user opens. Then we build the pipeline back from it.
That keeps the first version small and useful. A tailored fintech analytics build ships the layer that earns its cost first and passes the compliance gate early. It leaves room to add real-time and predictive models as the data grows.
If you are weighing data analytics services for fintech, scope that first layer carefully. Work with a team that has shipped fintech solutions end to end. We work as a custom fintech development team, from data pipeline to the app on top.
➡️ Tell us what your fintech product needs to measure, and we'll map the analytics build with a free estimate within 48 hours.
Fintech data analytics is the practice of collecting and modeling financial data to make product decisions automatically. It detects fraud, scores credit, and drives real-time choices inside the app. It often forms part of how the product makes money, rather than sitting in a separate reporting tool.
The four types build on each other. Descriptive analytics reports what happened, like weekly transaction volume. Diagnostic analytics explains why, such as a spike in failed payments. Predictive analytics estimates what happens next, like a borrower's default risk. Prescriptive analytics recommends the action, such as setting a fraud threshold on its own.
Traditional banking BI looks backward, with analysts reading last quarter's dashboards. Fintech analytics runs in real time, scoring a payment for fraud in milliseconds. Regulation is built into every model, and the data is more sensitive. Fintech also leans on alternative data, like cash-flow history, that banks rarely use for scoring.
Most run a three-layer pipeline: ingestion, processing, and visualization. A cloud data warehouse handles clean, structured records for reporting and scoring. A real-time system sits alongside it for fraud and payments, where decisions can't wait for a nightly batch. Data lakes come in later, once models train on logs or documents.
Keep raw personal data out of the analytics path wherever you can. Mask or tokenize card numbers and identities before they reach a model, which shrinks PCI-DSS scope. Pin storage to the required region for data residency, and log every access and automated decision for the audit trail. Give each service the least access it needs.
It depends on data volume, whether you need real-time or batch, and how much compliance work the product carries. Analytics is usually a slice of a wider build, and a full fintech MVP often runs $50,000 to $150,000. The practical approach is to ship the first useful layer, then expand as the data justifies it.


.svg)